


Nutrient Network project (NutNet)
Silwood Park hosts two sites of the Nutrient Network (NutNet) This is a cooperative experiment consisting of more than 130 grasslands sites distributed around the globe. The experimental design and data collection follow the same protocols in all participating sites allowing global analyses that aim to understand the impact of fertilization and alteration of plant-consumer interactions on herbaceous-plant dominated ecosystems. At Silwood Park, NutNet sites are located in Heron's Brook Meadow and Rookery Slope, mesic grasslands with sandy, acidic soil of the Bagshot Series surrounded by Pedunculate Oak (Quercus robur), Sycamore (Acer pseudoplatanus) and Silver Birch (Betula pendula) woodlands. European rabbits (Oryctolagus cuniculus), Muntjac Deer (Muntiacus reevesi) and Roe Deer (Capreolus capreolus) are the main grazers in Silwood Park grasslands.
This project started in 2007 and is hosted by the Department of Ecology, Evolution, and Behavior at the University of Minnesota. The experimental sites at Silwood Park are coordinated by Professor Mick Crawley and Dr. Catalina Estrada and supported by the Department of Life Sciences at Imperial College London.
NutNet google map
http://www.imperial.ac.uk/people/m.crawley
Publications
A complete reference list of NutNet publications can be found in Google Scholar
Selected publications for research that used Silwood Park plots
Firn J, et al. (2011) Abundance of introduced species at home predicts abundance away in herbaceous communities. Ecology Letters 14: 274–281.
Lind EM, et al. (2013) Life-history constraints in grassland plant species: a growth-defence trade-off is the norm. Ecology Letters 16: 513–521.
Seabloom EW, et al. (2013) Predicting invasion in grassland ecosystems: is exotic dominance the real embarrassment of richness? Global Change Biology 19: 3677–3687.
Borer ET, et al. (2014) Herbivores and nutrients control grassland plant diversity via light limitation. Nature 508: 517–20.
Seabloom EW, et al. (2015) Plant species’ origin predicts dominance and response to nutrient enrichment and herbivores in global grasslands. Nature Communications 6
Widdig M, et al. (2019) Nitrogen and Phosphorus Additions Alter the Abundance of Phosphorus-Solubilizing Bacteria and Phosphatase Activity in Grassland Soils. Frontiers in Environmental Science 7
Hautier Y. et al. (2020) General destabilizing effects of eutrophication on grassland productivity at multiple spatial scales. Nature Communications 11: 5375
Widdig M, et al. (2020) Microbial carbon use efficiency in grassland soils subjected to nitrogen and phosphorus additions. Soil Biology and Biochemistry 146
Schleuss PM, et al. (2021) Microbial substrate stoichiometry governs nutrient effects on nitrogen cycling in grassland soils. Soil Biology and Biochemistry 155: 108168
Chen Q, et al. (2022) Nutrients and herbivores impact grassland stability across spatial scales through different pathways. Global Change Biology 28: 2678-2688
Experimental design
General methodology adapted from NutNet's protocols and templates documents.
The core experiment is a completely randomized block design with three blocks, 10 treatments per block, and three replicates per treatment (N = 30 total experimental units). Each experimental unit is 5 x 5 m in size, with the experimental units separated by at minimum 1 m.
- N: Ammonium nitrate (NH4NO3) at 144 kg ha-1year-1
- K: Muriate of potash (KCl:NaCl ) at 224 kg ha-1 year-1
- P: Triple superphosphate (Ca(H2PO4)2·H2O) at 35 kg ha-1 year-1
| Colour code | N | P | K | Enclosure |
|---|---|---|---|---|
| White | 0 | 0 | 0 | 0 |
| Yellow | 0 | 0 | 1 | 0 |
| Blue | 0 | 1 | 0 | 0 |
| Red | 1 | 0 | 0 | 0 |
| Yellow & blue | 0 | 1 | 1 | 0 |
| Yellow & red | 1 | 0 | 1 | 0 |
| Blue & red | 1 | 1 | 0 | 0 |
| Grey | 1 | 1 | 1 | 0 |
| White | 0 | 0 | 0 | 1 |
| Grey | 1 | 1 | 1 | 1 |
| 0=control, 1=nutrient/fence added | ||||
Data
Data of aboveground standing biomass and percent cover has been collected from 2008. Specifically, percentage of cover of each plant species, bryophytes and bare ground in each plot is available for Heronsbrook for 2008, 2010 to 2013, 2016, 2021 and 2022 and from Rookery from 2008, 2010 to 2013 and 2016
Data of aboveground biomass separated by functional groups (dead organic matter, bryophytes, graminoids, herbs and woody plants) is available for both sites from 2009 to 2012.
Data of aboveground biomass measured for each plant species, bryophytes and dead organic matter is available for both sites from 2009 and 2010
Find more in the Nash Field KS metadata for this experiment.
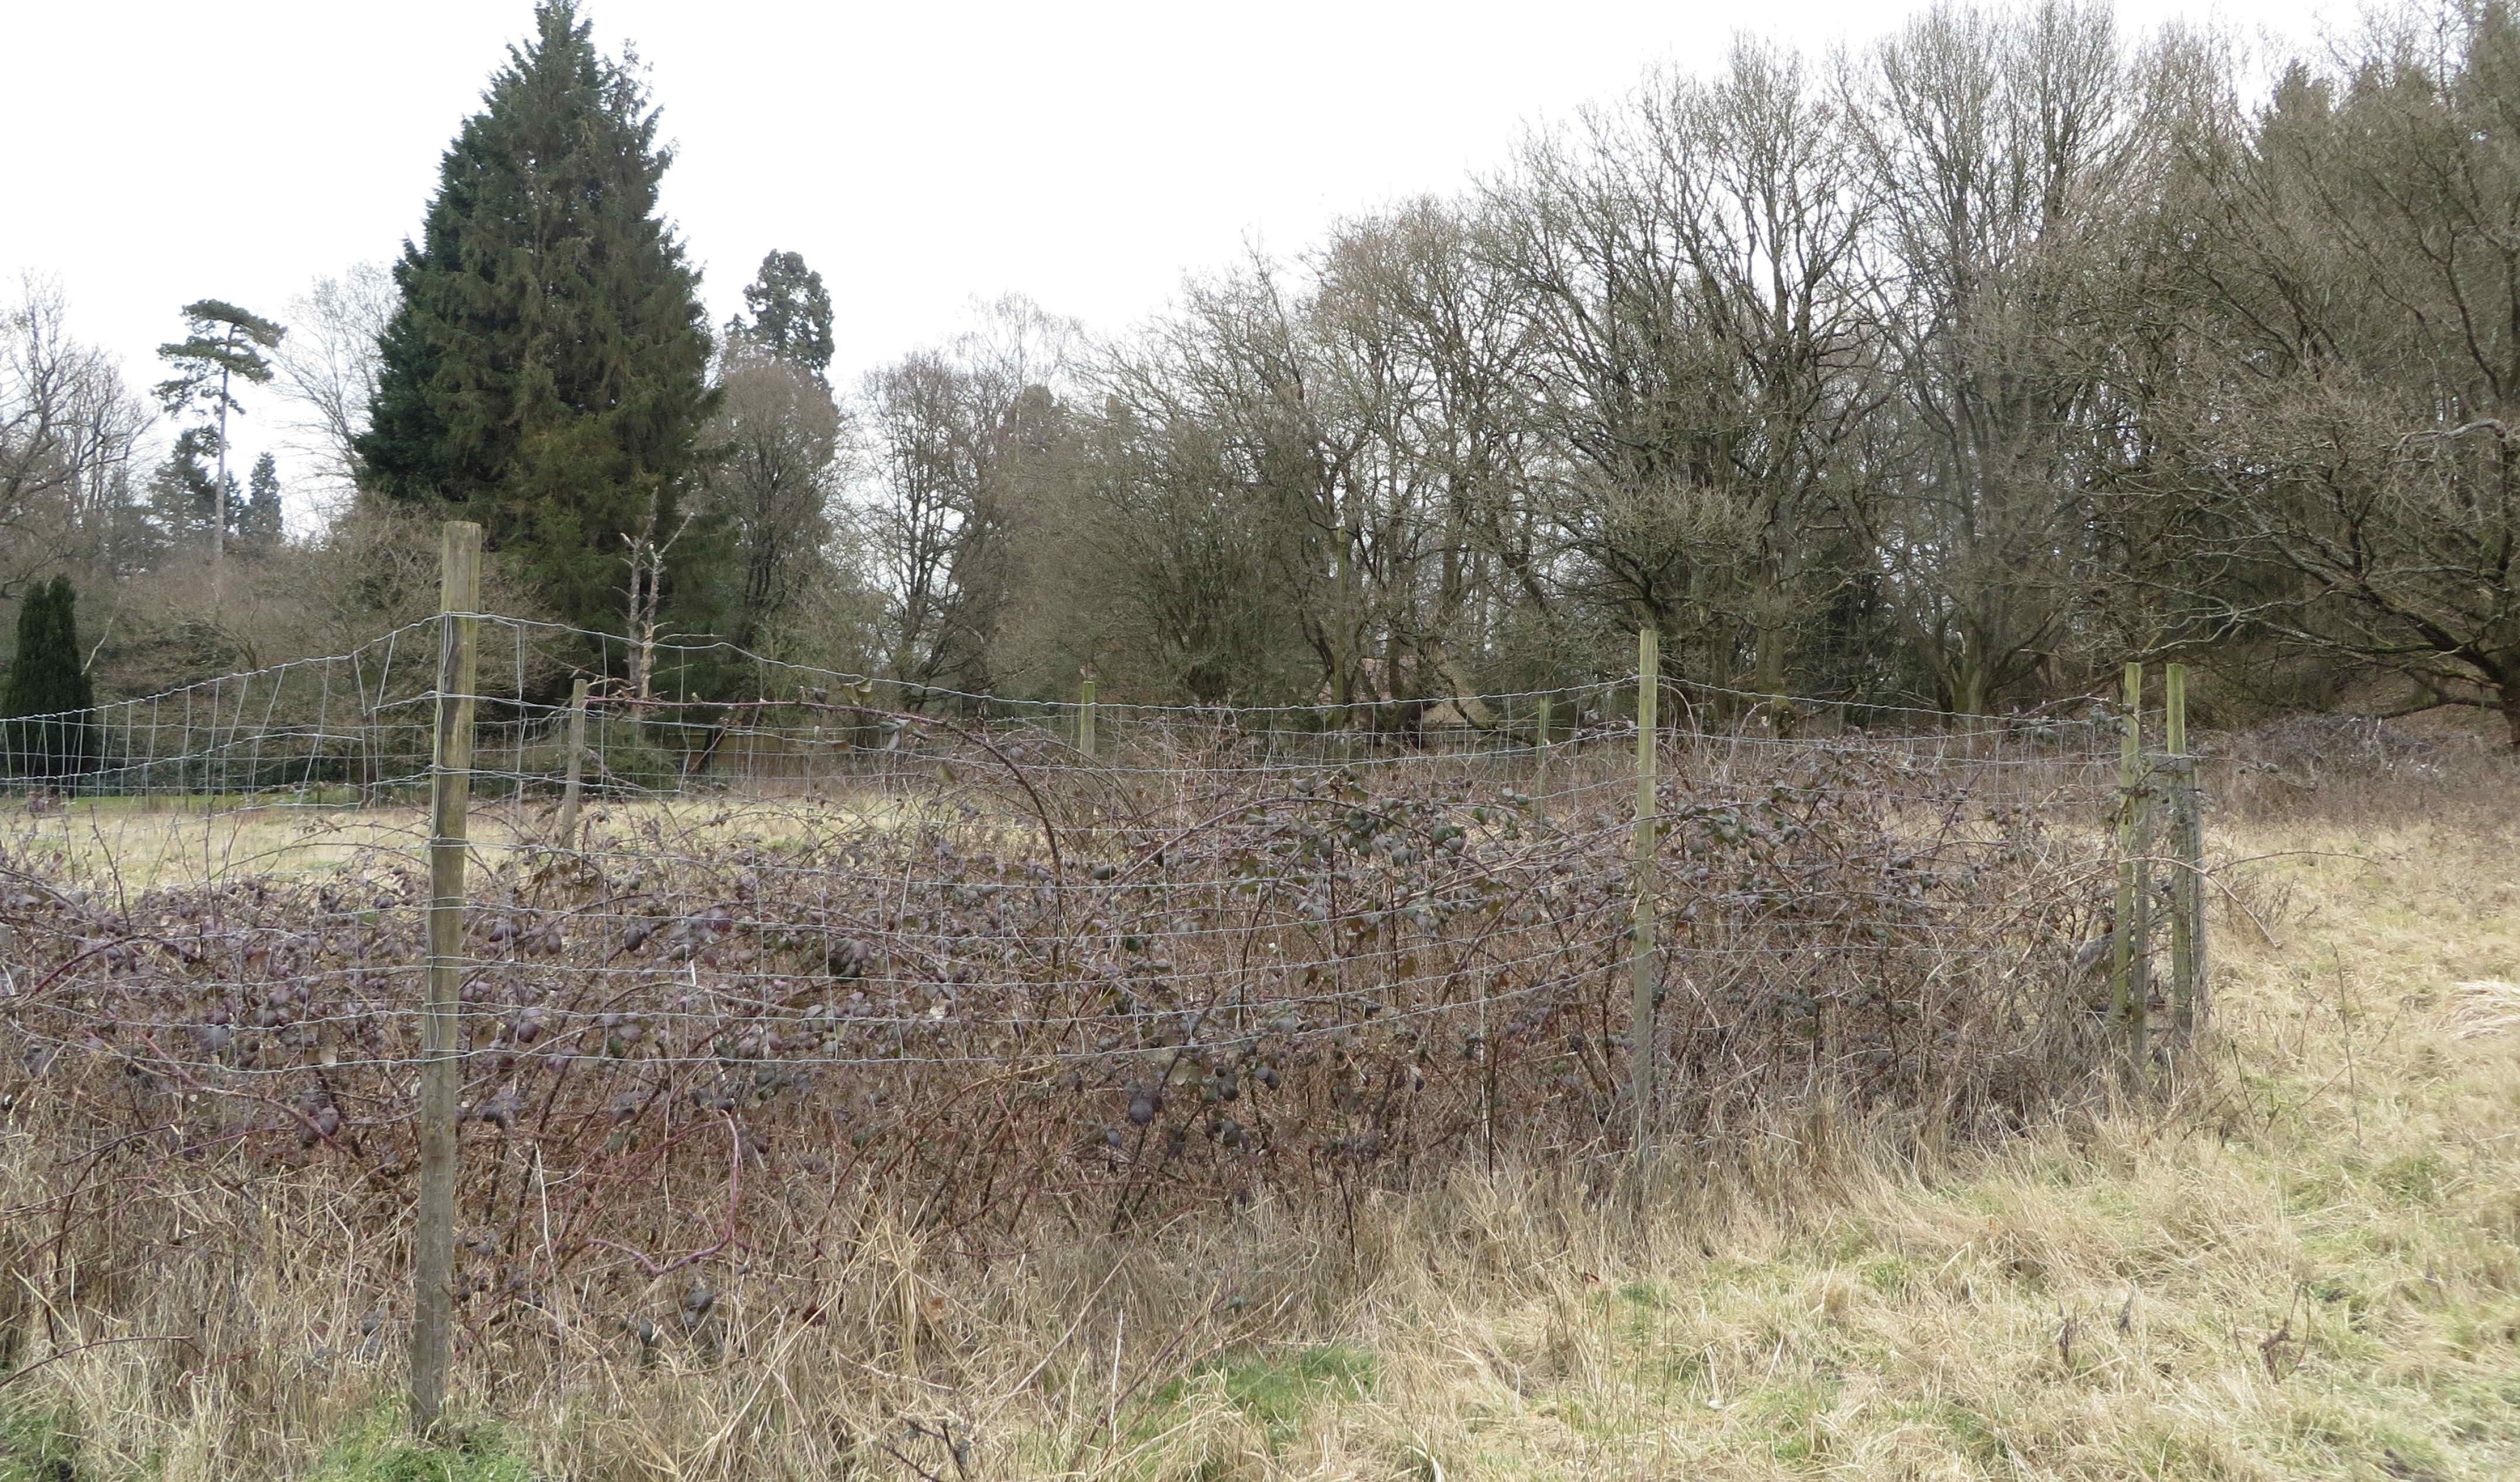
Blackberry bushes inside fenced plot in Heron's Brook Meadow site, March 2016
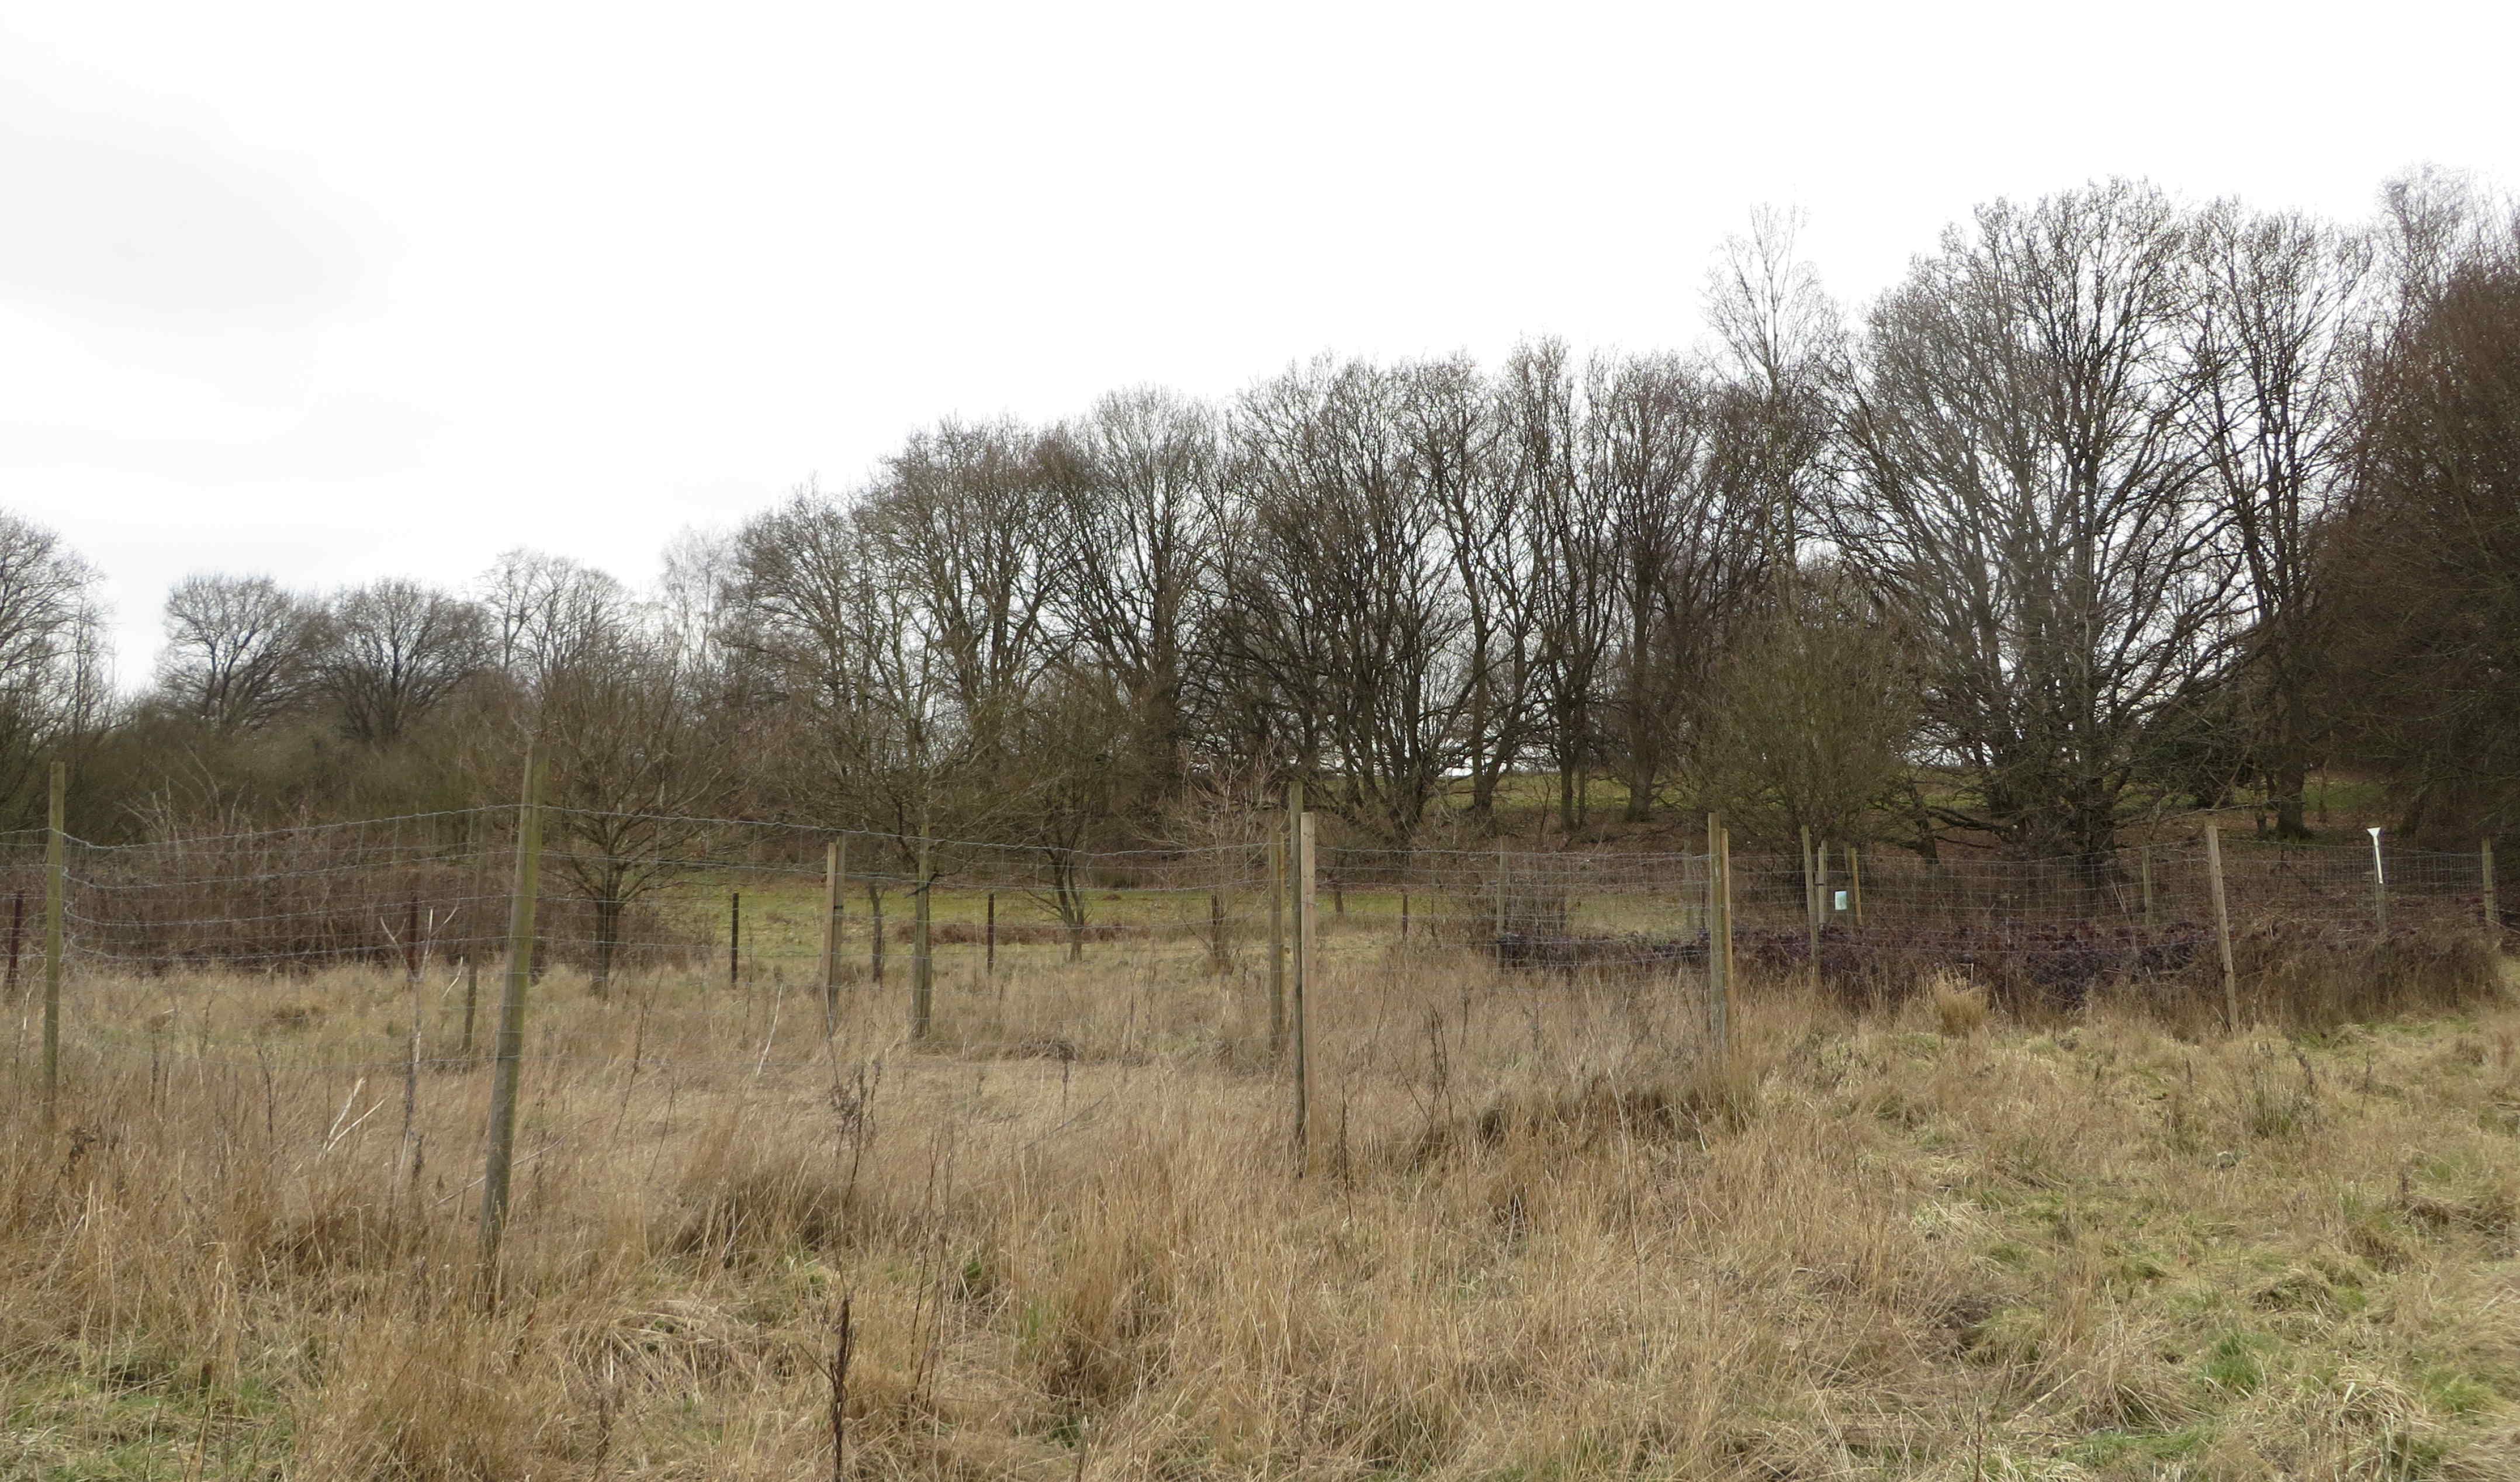
Two fenced plots in Martin's Brook Meadow site, March 2016. The close left plot receives a mixture of NPK+ nutrients while the right far plot is not fertilised. An unfenced plot located between the two fenced plots is fertilised with a NPK+ mixture
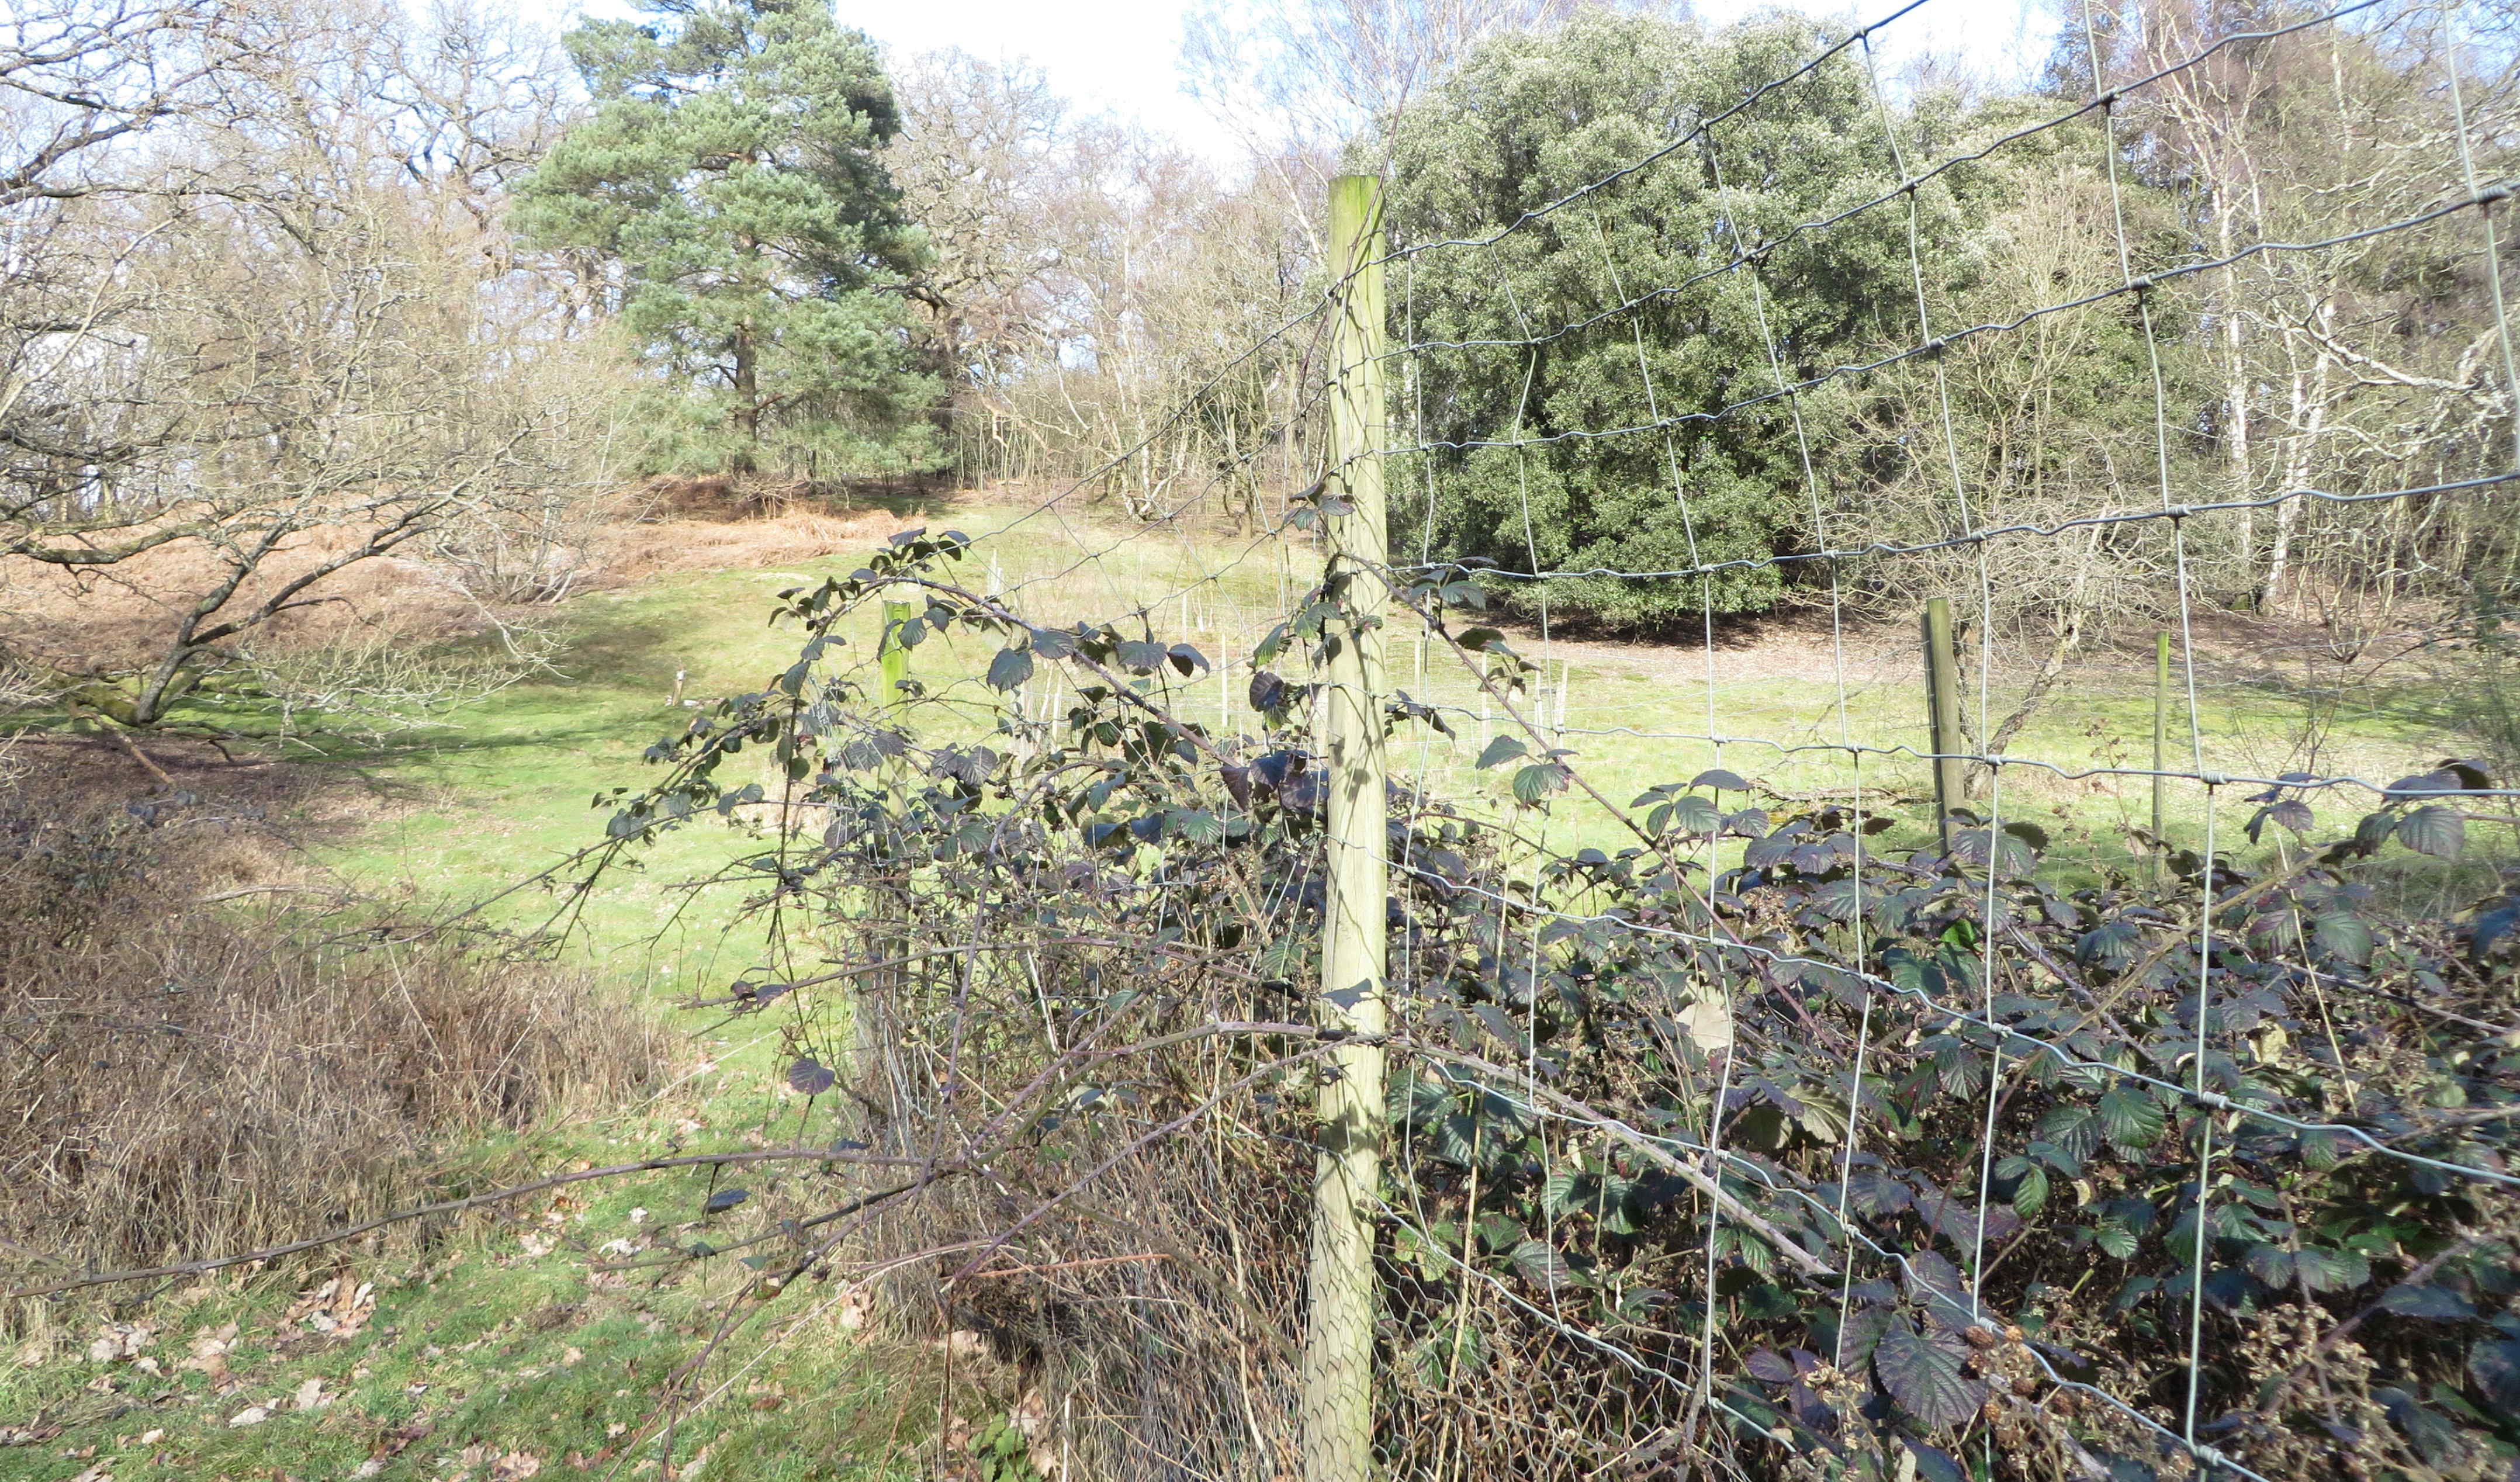
Fenced plot in Rookery Slope site
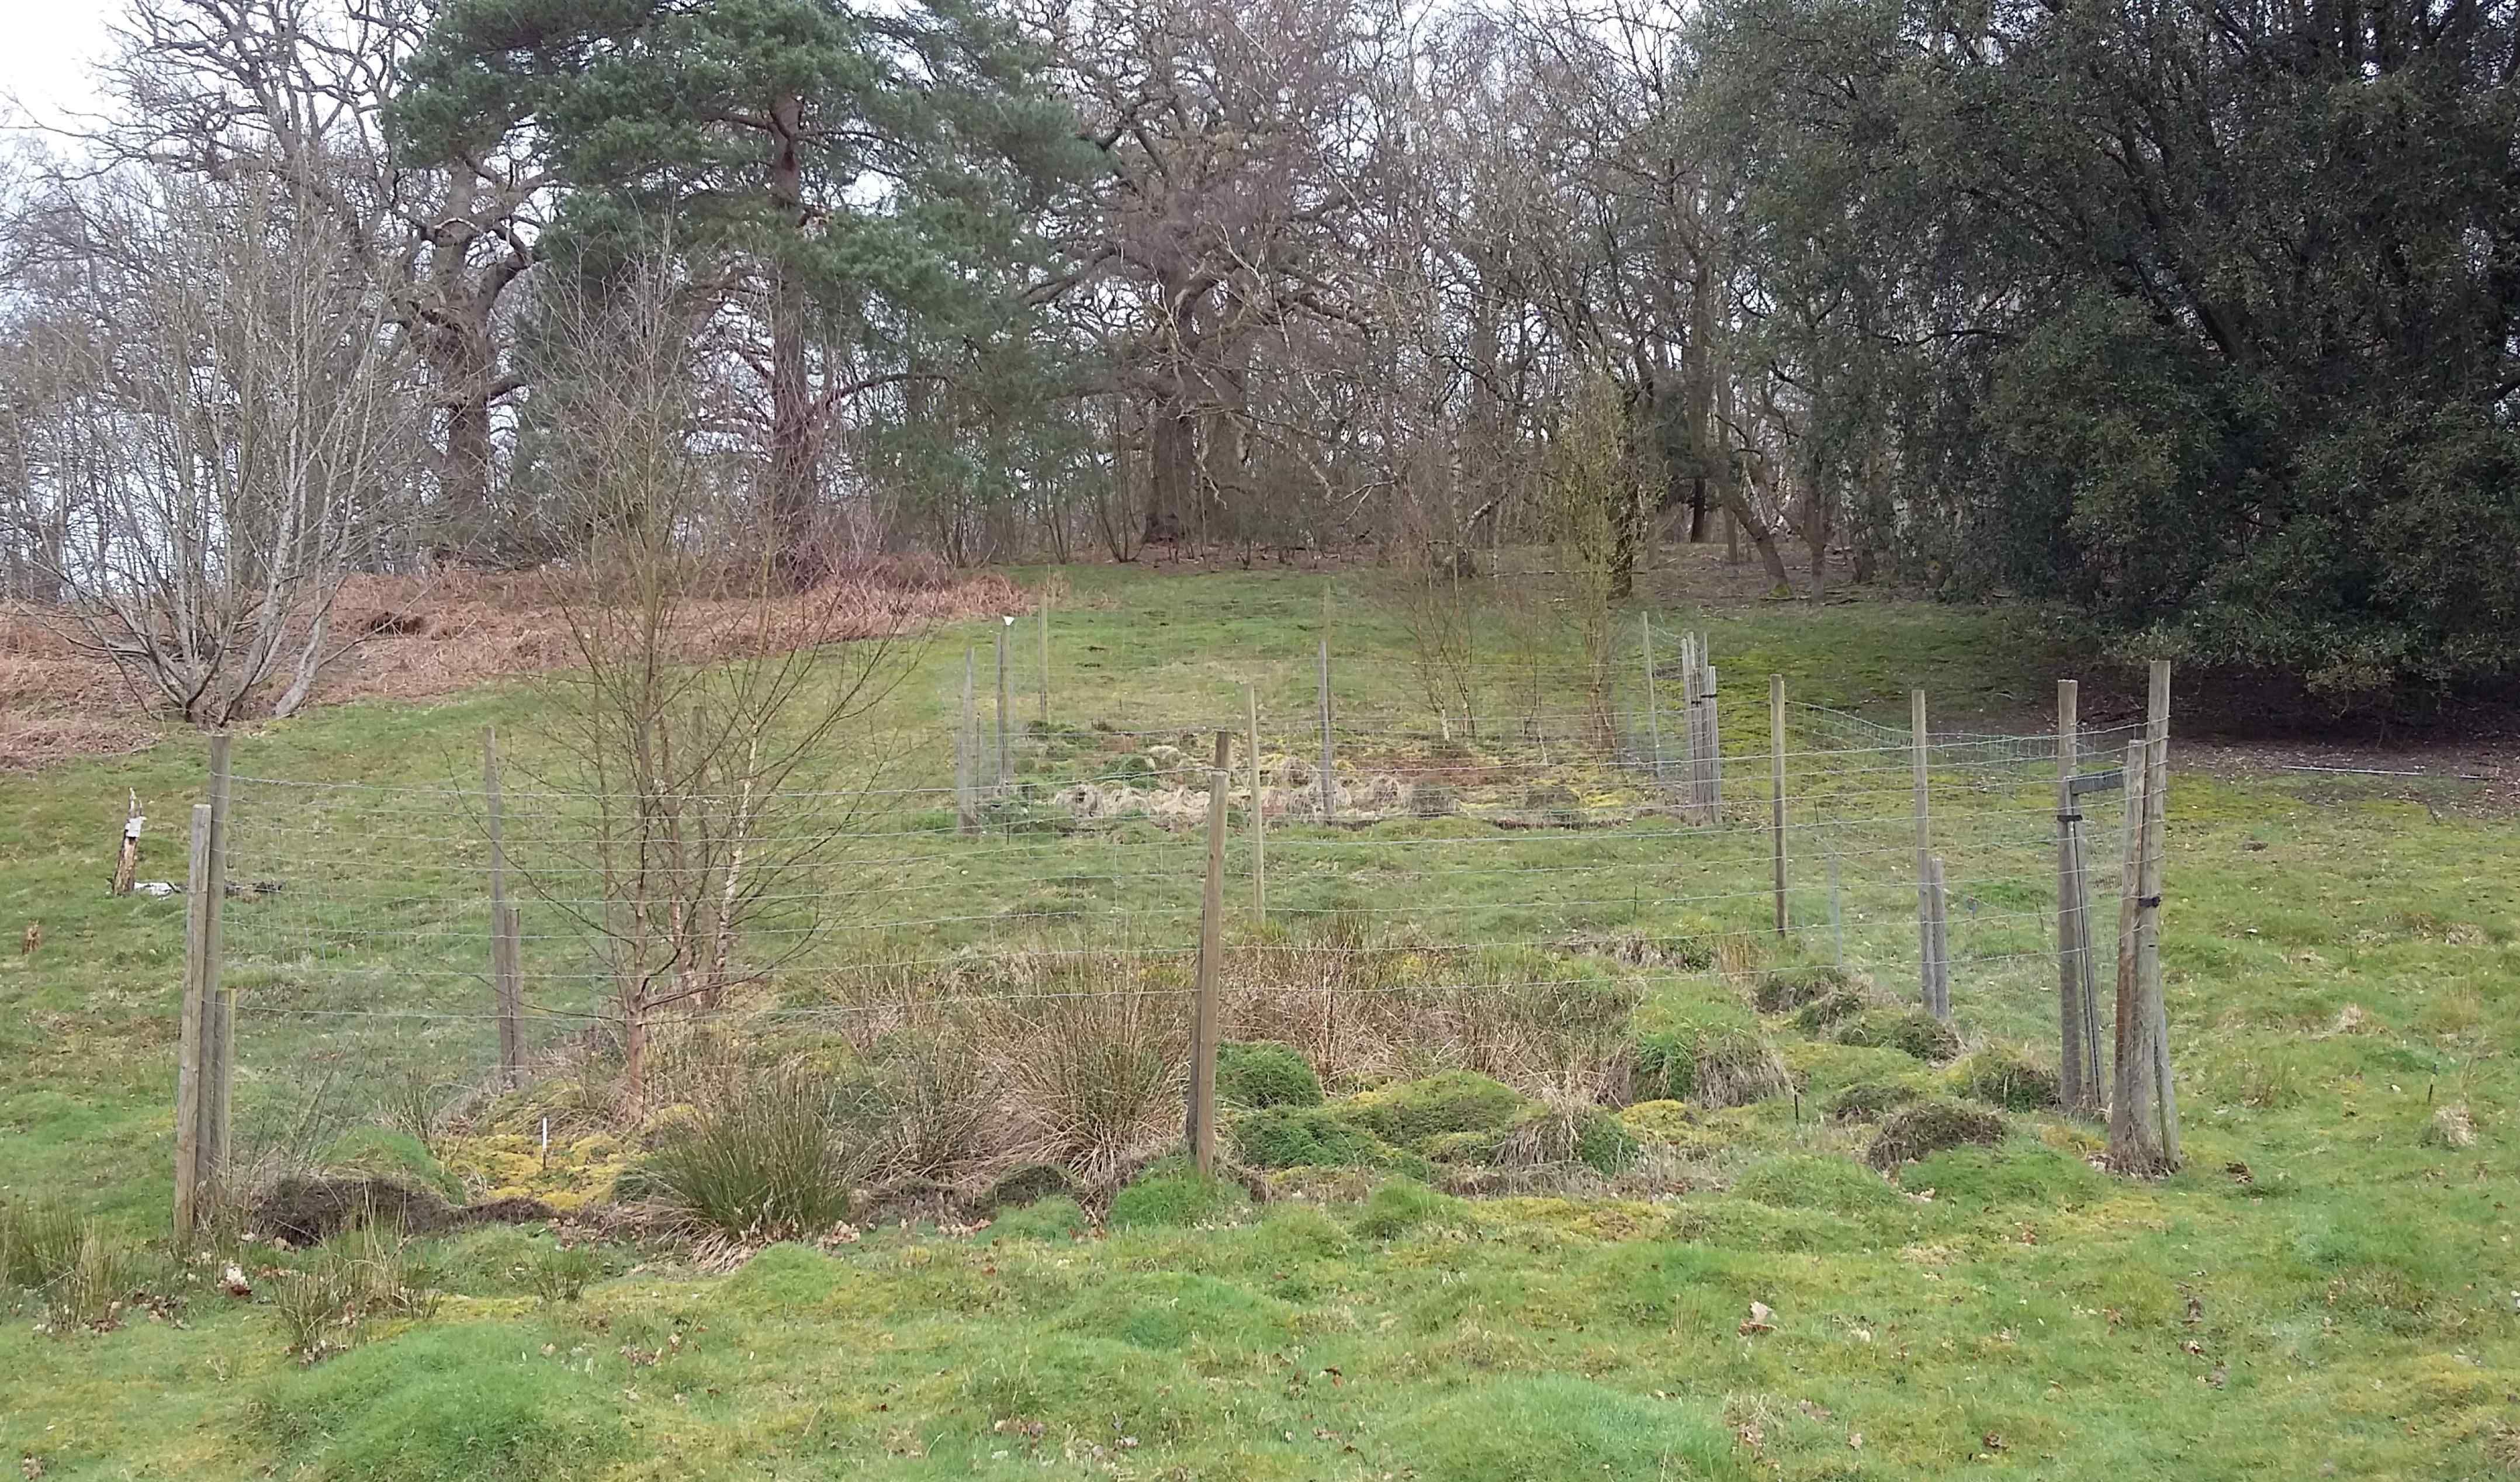
Fenced plots in Rookery Slope site, March 2016. The back plot receives a mixture of NPK+ nutrients while the front plot is not fertilised. A unfenced plot in between the two fenced plots is fertilised with N and K+
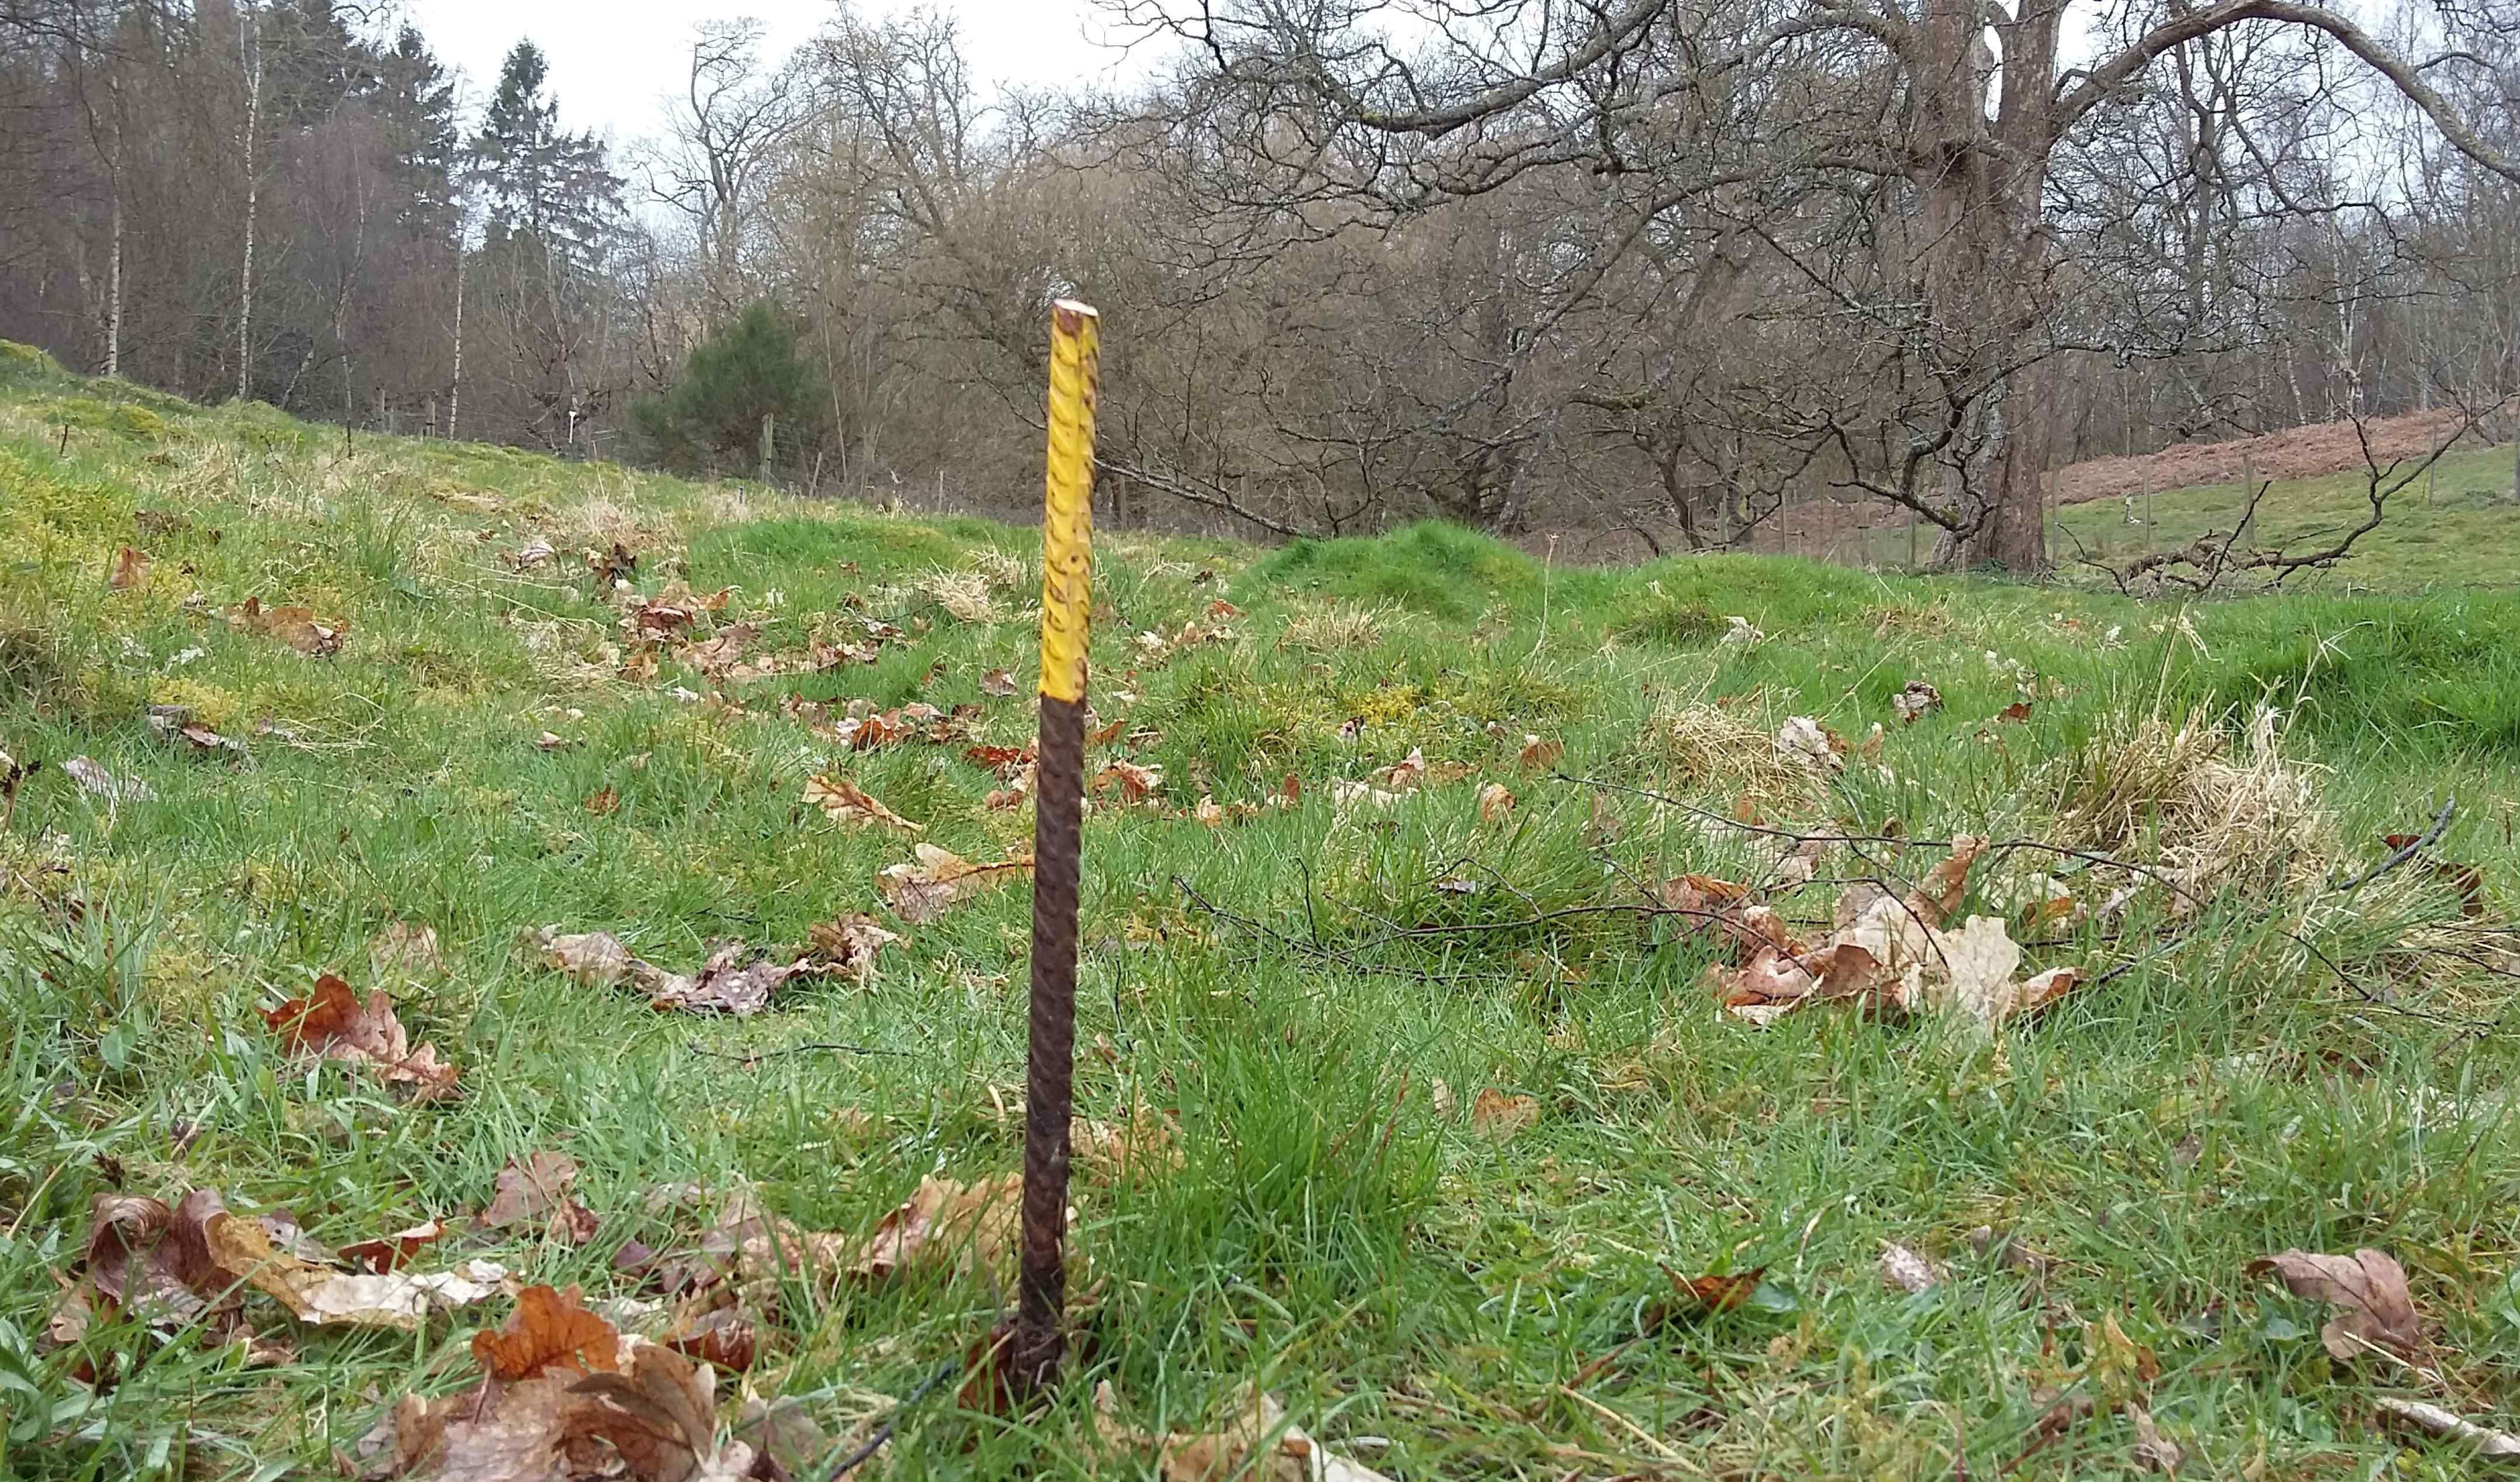
A yellow-painted iron rod indicating the corner of a plot fertilised with potassium
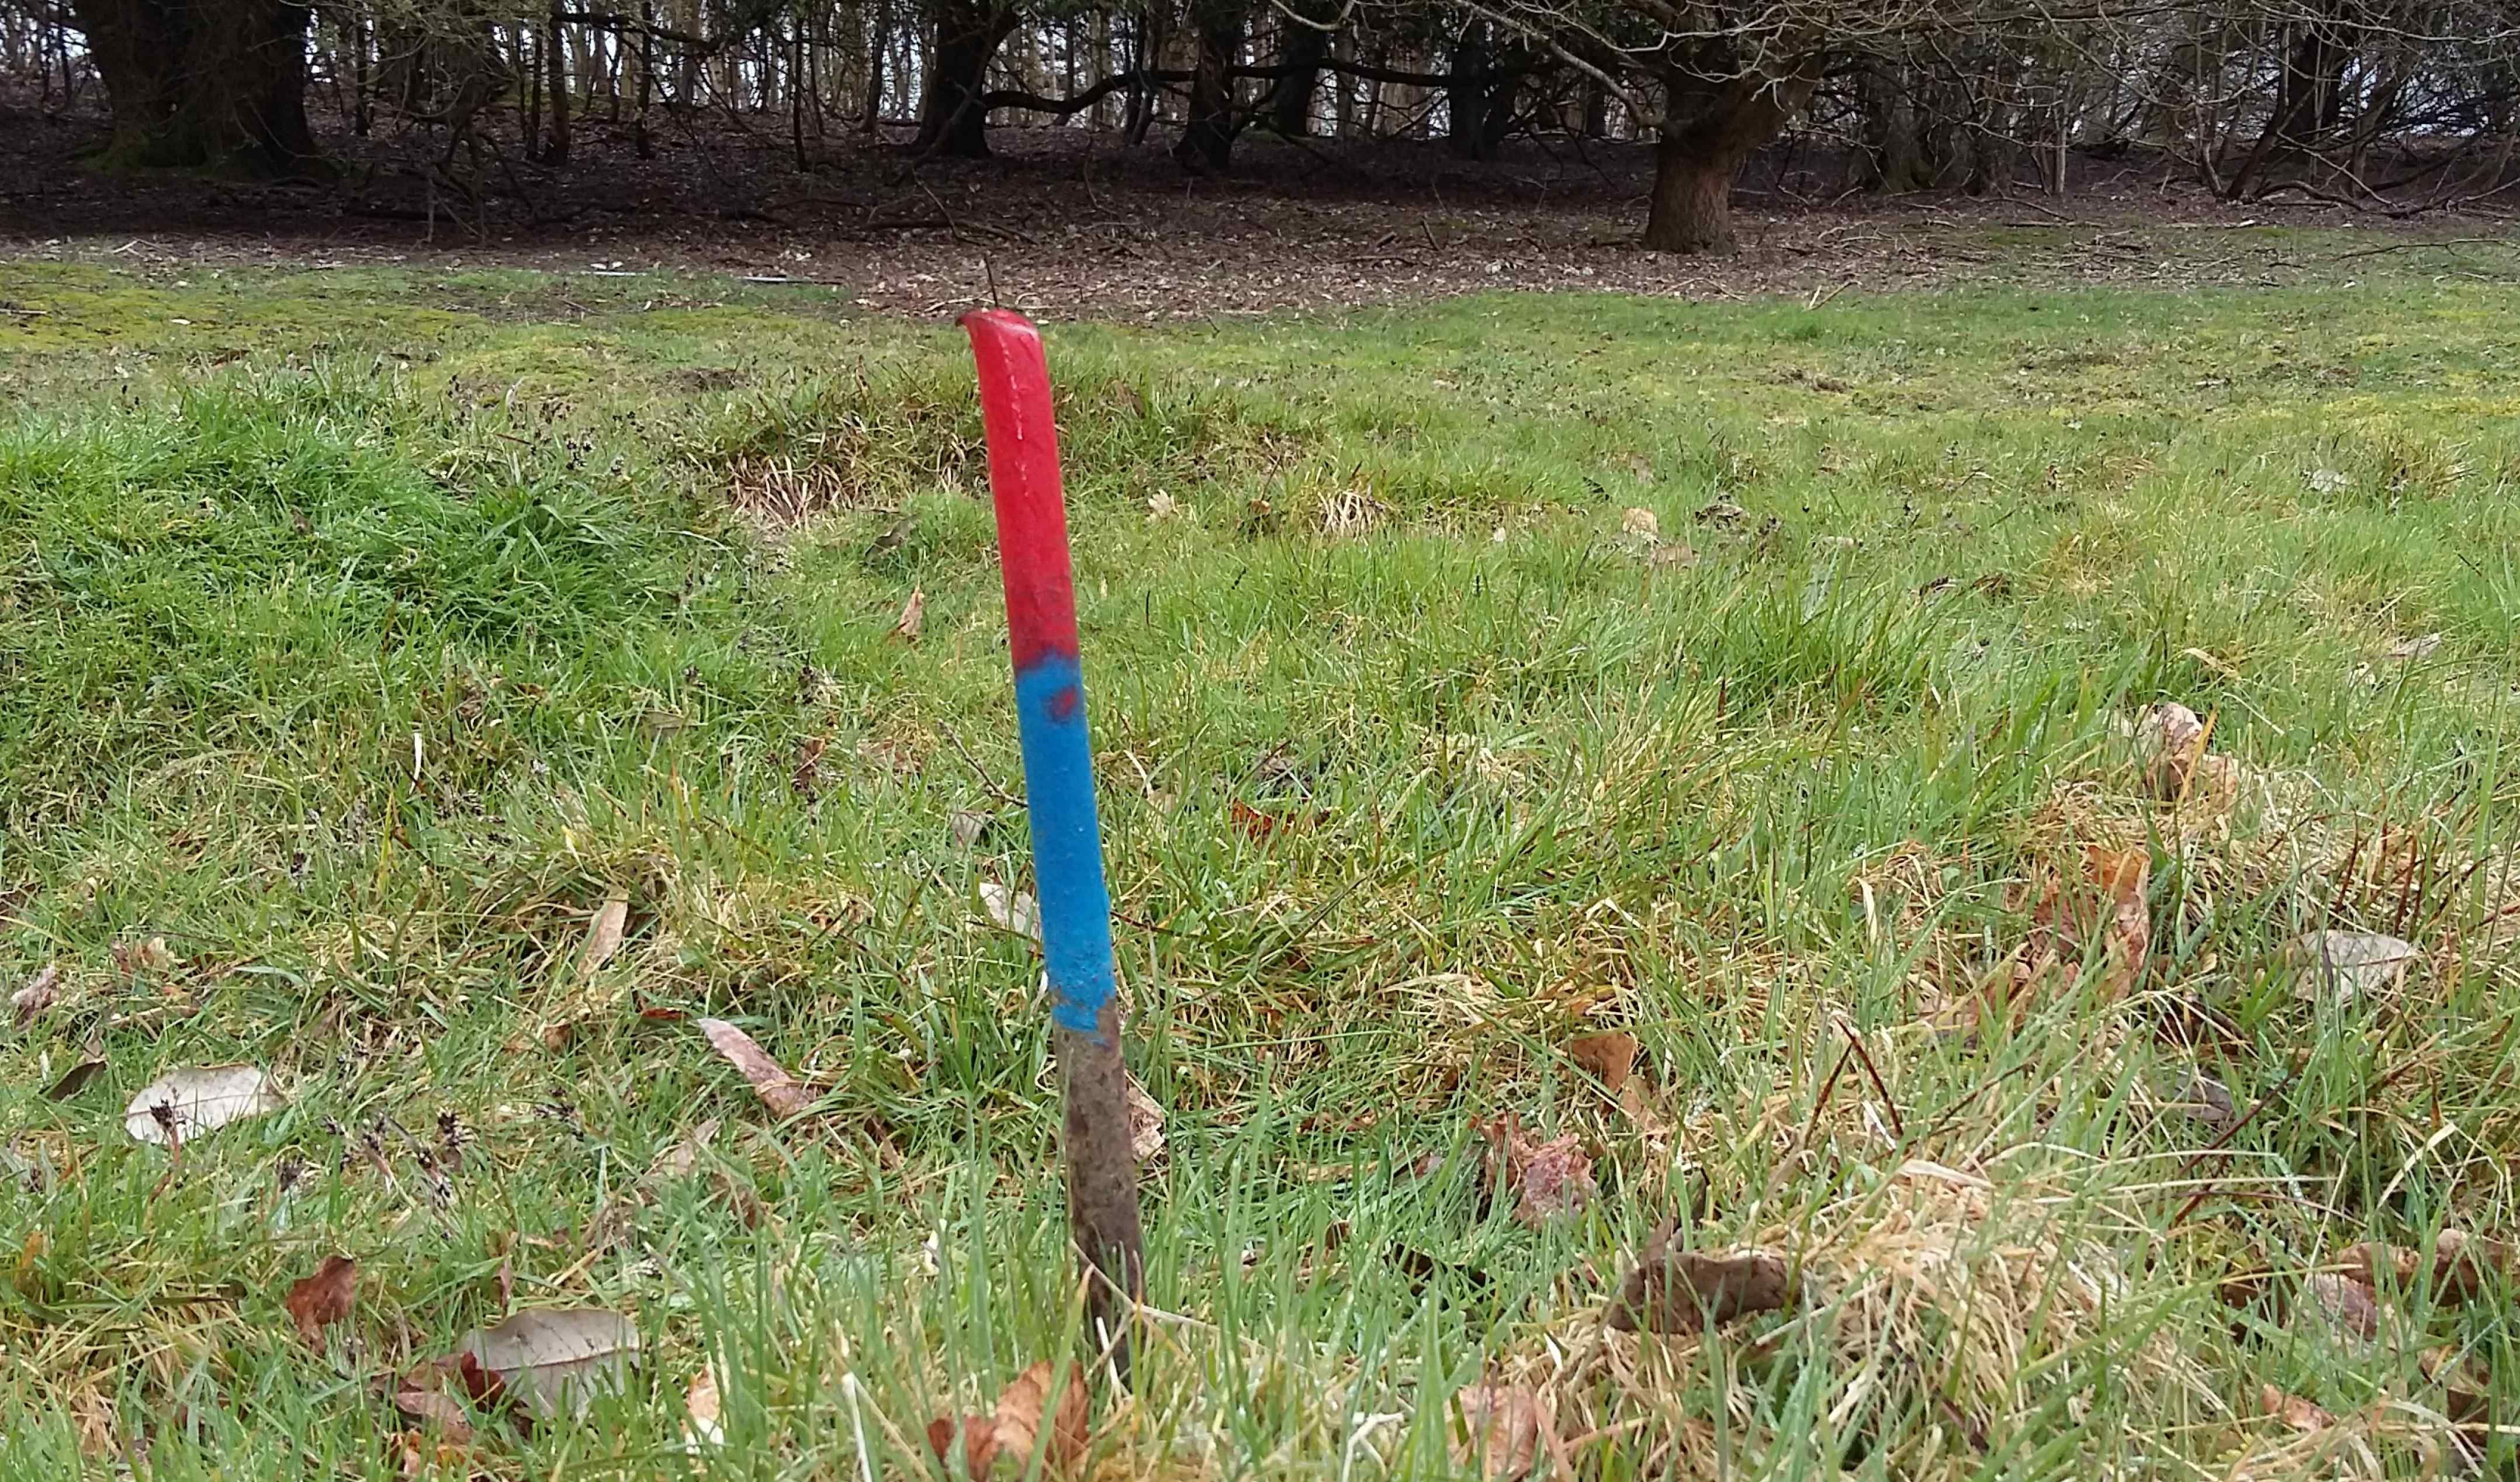
A red and blue-painted iron rod indicates the corner of a plot fertilised with nitrogen and phosphorus