


Multi-colour analysis
What is a Fluorochrome?
A fluorescent compound that emits light at a defined wavelength on excitation by a laser. Fluorochromes can be conjugated to an antibody made against a marker of interest. Two important things to think about when choosing which fluorochromes to use are the brightness of the fluorochrome and its spectral overlap.
Spectral overlap
Each fluorochrome emits light in a range of wavelengths and for two fluorochromes there may be a part of the spectrum where they both emit light. For example, FITC has its maximum emission at 520nm and PE has its maximum emission at 565nm but the emission spectra of FITC are so wide that some of the FITC signal ends up in the PE detector. This is called spectral overlap.
Spectral overlap can be avoided by choosing fluorochromes that are far apart or excited by different lasers. However, in multi-colour analysis it is not possible to avoid spectral overlap so compensation is used to reduce spectral overlap.
Glass filters that only allow a defined wavelength range of light are placed in front of the photo-multiplier tube (PMT) detectors. This allows PMT detectors to become highly specific to the particular emission characteristics of different fluorochromes. Compensation removes the non-specific signal produced by a fluorochrome in other detectors. This is why it is important to have singly labelled controls when setting up your experiment.
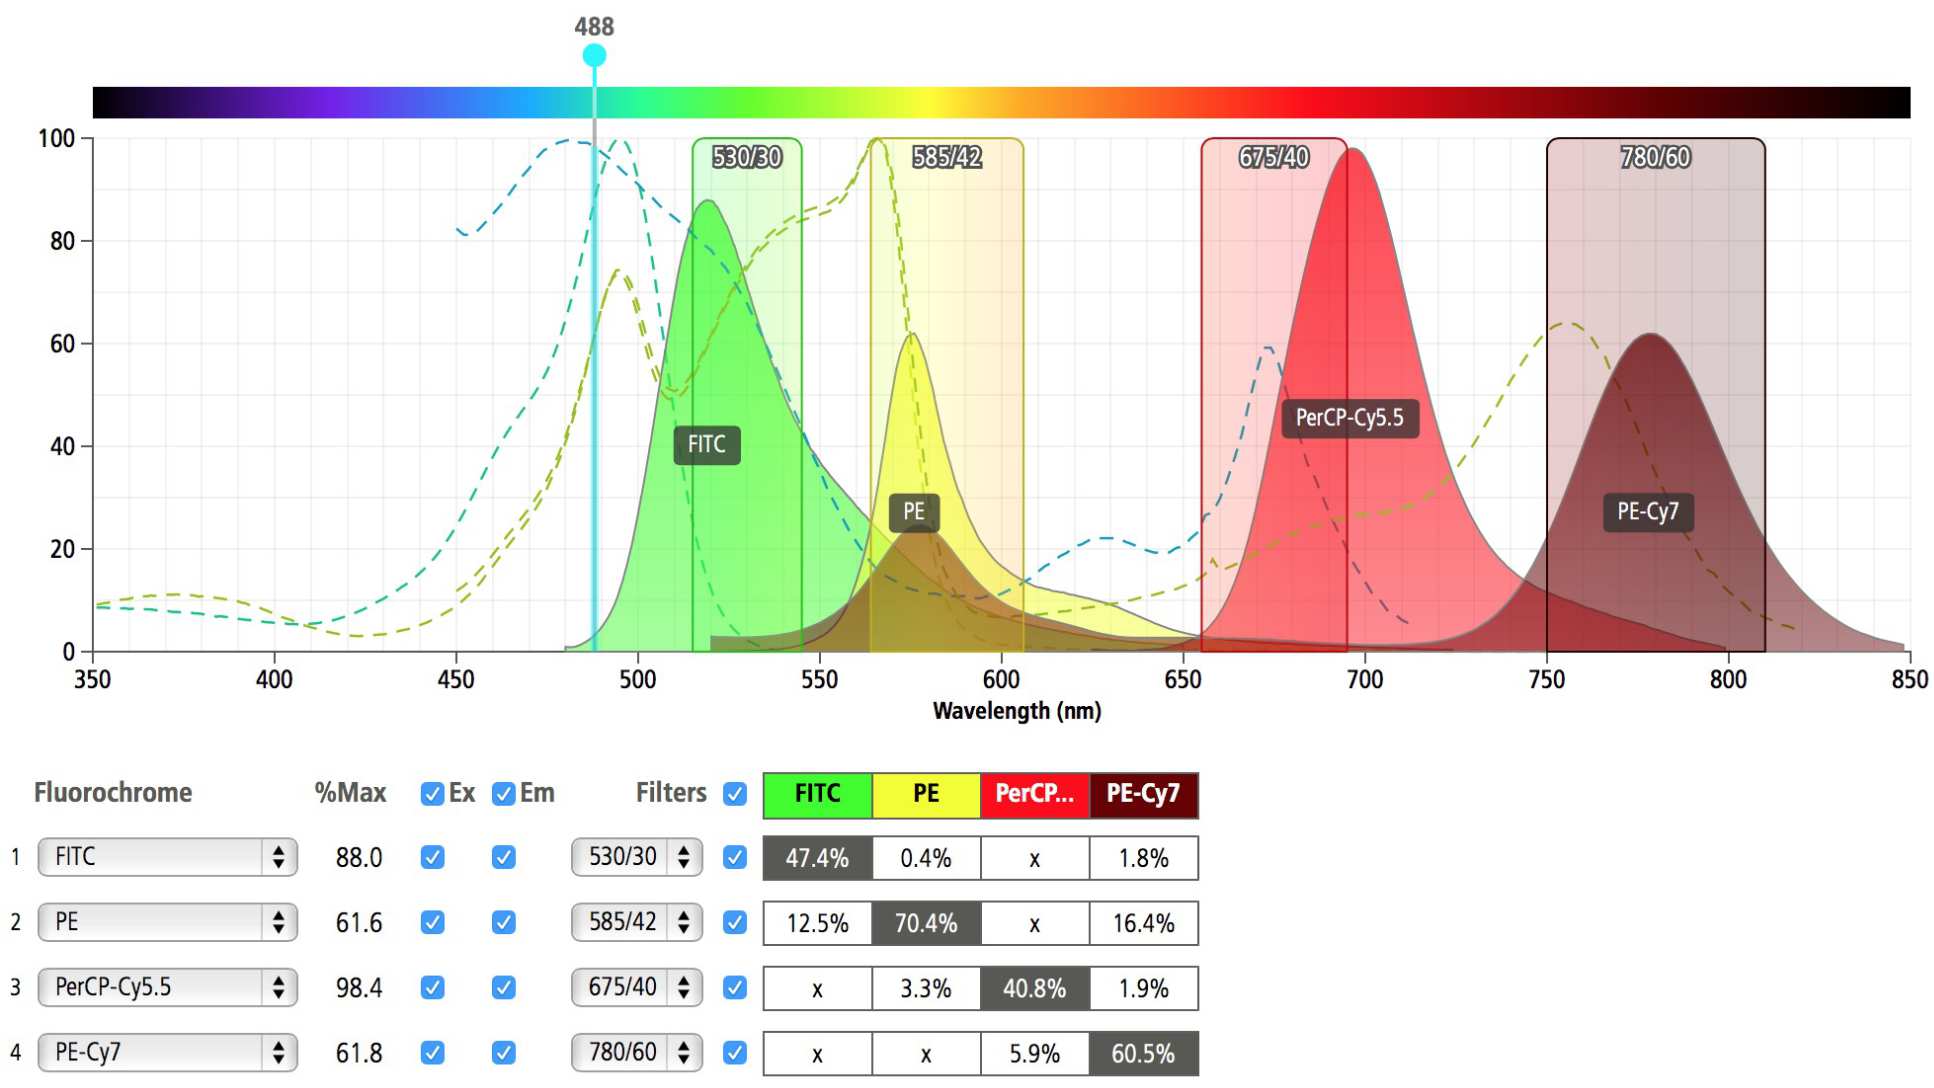
*Image generated using 'BD Fluorescence spectrum viewer'.
Compensation
Compensation measures the amount of spectral overlap of one fluorochrome into the other active detectors on the FACS machine. Each fluorochrome being used is measured in turn and a matrix of spectral overlap is produced. The software then performs a mathematical calculation and the correct amount of compensation is applied to each detector.
Stain index
The stain index of a fluorochrome defines how 'bright' the emission signal appears to the cytometer. It is calculated using the formula:
SI=D/W
where D is the difference in median fluorescence intensity (MFI) of the positive and negative populations and W is the width of the negative population. It is used to define a positive signal (red) from background signal (blue), the higher the separation of these two signals, the higher the stain index for that particular fluorochrome. The image below is from the BD Biosciences Fluorochrome Reference Chart (PDF).

Designing your panel
Panel design can be complicated. We are happy to help users with their panel design. Factors to take into account are: instrument configuration, antigen density of markers of interest, co-expression of antigens and stain index.
Instrument configuration
The specific configuration of the cytometer being used is important - please see BRC FACS Aria II configuration (PDF).
Antigen density
Antigen density is the number of antigen molecules found on the cell surface. For example, CD3 is highly expressed on T-Cells at approximately 200k copies per cell, whereas CD25 has less than 1000 copies per cell. Typically it is a good idea to put weakly expressing markers on the brightest colours (those with the highest stain index).
Co-expression of antigens
Two antigens of interest that are expressed on the same cell are more likely to cause spectral overlap and poor compensation. For optimal resolution, fluorochromes excited by different lasers should be used with those antigens that are co-expressed on the same cell
Multi-colour data analysis
The Facility has dedicated workstations for users to analyse data generated by flow cytometry and confocal imaging. There are several software packages available for both quantitative and qualitative data analysis. Please contact the Facility staff for more information and requests for training. New tools are being developed to analyse multi-colour cytometry data sets - for example, viSNE.