


OneZoom: The Tree of Life
As we increase our ability to capture detailed information about a wide range of subjects, large and complex datasets are becoming increasingly common. At the same time, advances in computing power and storage are allowing us to perform intricate analysis of this information; however, the most complete understanding of these datasets can be best achieved through a combination of computer analysis and human interpretation. An ability to visualise these large and complex datasets is something that can greatly help with these ambitions.
One of the oldest large and complex dataset is the “tree of life”; to phylogeneticists this provides the complete map and relationships of all life on the planet and for decades, researchers have sought ways to visualise this information. For Dr James Rosindell, this is a problem that he too has considered during the course of his career.
Fractals are an unusual type of geometric object because of the way in which they scale as you increase and decrease them in size. In normal geometry, doubling the width of an object results in an overall increase in size of two to the power of the dimension. For example, if you double the width of a square, its area is four times greater (22); if you double the width of a cube, its volume will be eight times greater than the original (23). However, for a fractal, if the width is doubled, the spatial content is increased by a power that is not a whole number. Fractals typically have patterns that infinitely repeat regardless of the scale at which we view them allowing us to zoom in and out but still see what appears to be a similar representation. A few years ago James had also been considering how these fractals might be used to visualise huge mind maps of information, an idea which would lay dormant for some time.
During a visit to Charles Darwin’s Down House with Luke Harmon (a colleague from the University of Idaho) they took a stroll around Darwin’s thinking path with the ambition to draw inspiration for new ideas. It is unfortunate that none of the ideas that they conceived on the path that day have come to fruition yet, but less than two hours later the topic of tree visualisation arose and from that James was able to suggest how his fractal mind map might used to provide a solution.
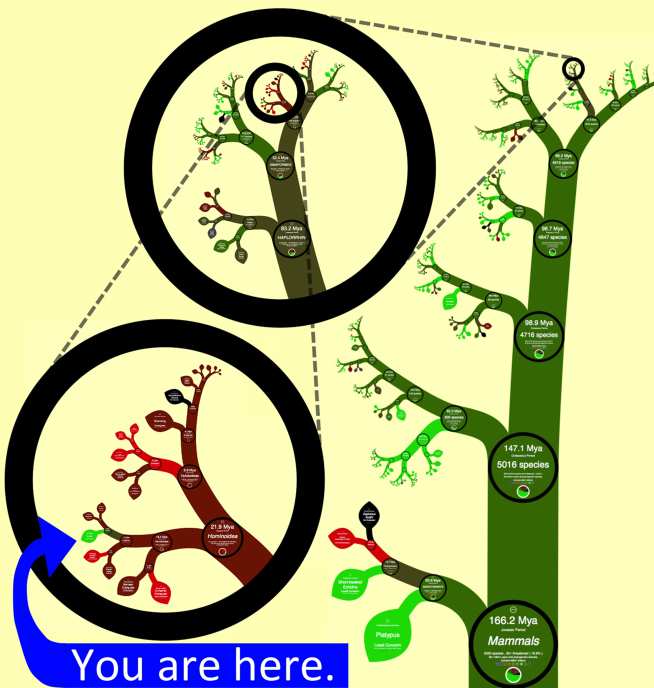
After many years of hard work and with the assistance of some funding from the NERC IAA, James has developed the OneZoom Tree of Life Explorer and formed a science communication charity, OneZoom CIO. OneZoom exists as a website enabling users to explore the “tree of life”, which to date has attracted over 1.3 million users, impacting upon understanding, learning and participation within schools and universities as well on the way members of the public view biodiversity and evolution. It also impacted upon creativity, culture and society by providing interactive exhibits at eight public institutions including the Australian museum and Darwin and Dinosaurs together attracting 550,000 visitors per annum. OneZoom inspired popular science book graphic materials, design of an evolution garden, and provided software for digital artwork. OneZoom has played a key role in 21 public facing science communication initiatives including educational walks and science festivals. An end result is increased appreciation of biodiversity and the degree to which it is under threat, including promoting conservation and personal actions to help the environment.
The team has also adapted OneZoom technology to the field of geneaology, establishing a new company, ZoomPast Ltd. ZoomPast enables users to create, share and view a wide variety of personal and public family trees. It has an independent user base of 77,000, as well as supporting education in genealogy and appearing at trade shows attended by 38,000 people.