


Advanced X-ray diagnostics
Advanced X-ray diagnostics
X-pinch radiography
- Simon Bland
- Deep Lall (summer student)
- Guiji Wang (Academic Visitor)
- Roland Smith
Over summer 2014 Simon Bland worked on a CEMS funded project to radiograph dense foams for use in experiments on the Orion laser. Working with a UROP student, Deep Lall, and Guiji Wang, an academic visitor from the Institute of Fluid Physics (China), a small-footprint pulsed power generator ‘NENE’ was recommissioned. This was then used to drive X-pinch implosions, providing a high intensity point source of X-rays.
Some 40 experiments took place to optimise X-ray generation in the wavelength range required for imaging through the ~150mg/cc HIPE foams. Some re-engineering was undertaken to allow multiple foams and X-ray diagnostics to be fielded simultaneously. The generator reliably provided ~35-40kA pulses in 50ns to the load region with very little jitter. We used time integrated pinhole cameras and slit cameras to monitor the size of the emission region formed by the X-pinches in multiple wavebands; X-ray diodes followed to examine temporal emission, and several different radiography configurations with various foams targets (some prediagnosed) provided by AWE.
Foams were radiographed using Fuji image plate at up to 2m from the X-pinch source, allowing for point projection magnification of images. The highest contrast results were obtained with stainless steel or tungsten X-pinch wire loads. Multiple foams were imaged simultaneously demonstrating the potential for rapid sorting of large batches of test pieces.
The X-pinch source is now being used to explore X-ray absorption spectrometry and X-ray diffraction for use in dynamic compression experiments on MACH and the miniature SHPB.
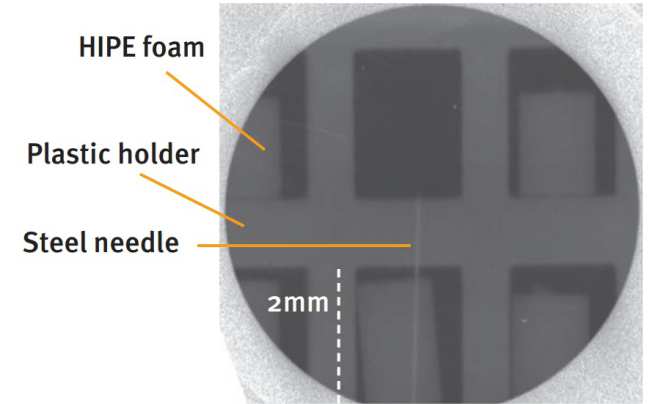
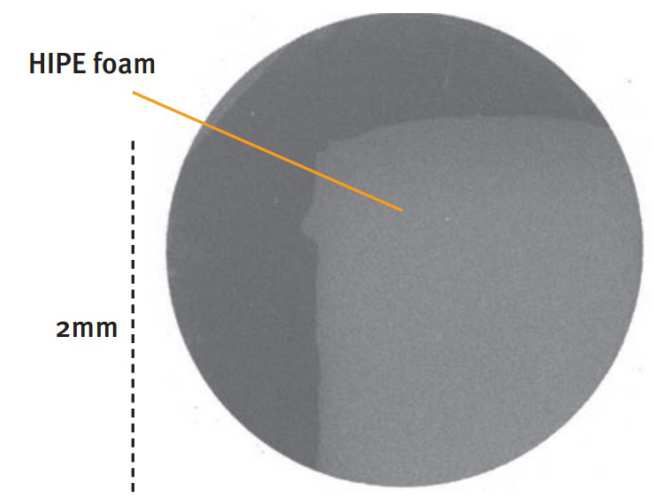
Figure 3: (top right) High magnification radiograph of a single 3x5mm HIPE foam, tungsten X-pinch, 12μm Al transmission window. Imaged with single shot at >2m from highlighting the high-flux available for multi-foam or point projection imaging.
Figure 4: (Bottom right) Radiograph of 6 foams using a 12um Ti transmission window (3-5 and above 6KeV). 300um, stainless steel needle used to provide a fiducial behind the centre foam, lower row
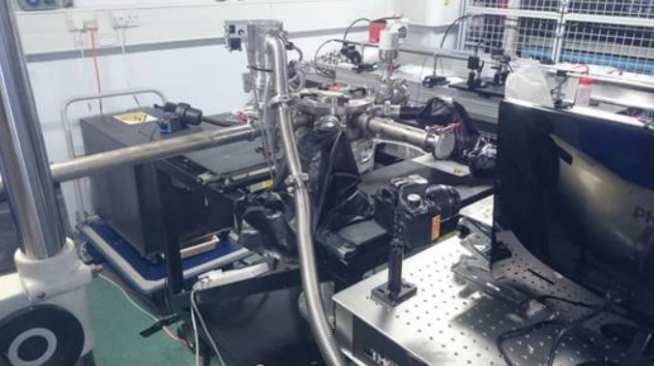
Figure 5: (Below) The NENE pulsed power driven x-pinch used for radiographing foams
Ultrafast phase contrast imaging of laser driven shocks using betatron X-rays
- David Chapman (RA)
- Thomas White (RA)
- Michael Rutherford (PhD student)
- Daniel Eakins
- Stuart Mangles

Bright, high-energy photon sources, such as synchrotrons and more recently the new generation of X-ray free-electron lasers, offer the attractive combination of high brilliance, short pulse duration and high-energy X-rays. With their ability to probe matter on the atomic scale with unprecedented temporal and spatial resolution, they have been used in a range of applications spanning the physical, biological, and medical sciences but are particularly suitable to imaging highly transient events, such as shockwave evolution. Alternatively, betatron X-rays produced within a laser-plasma wakefield accelerator provide an exciting complementary energetic photon source to these established large scale facilities.
As a complementary research avenue to our pioneering efforts
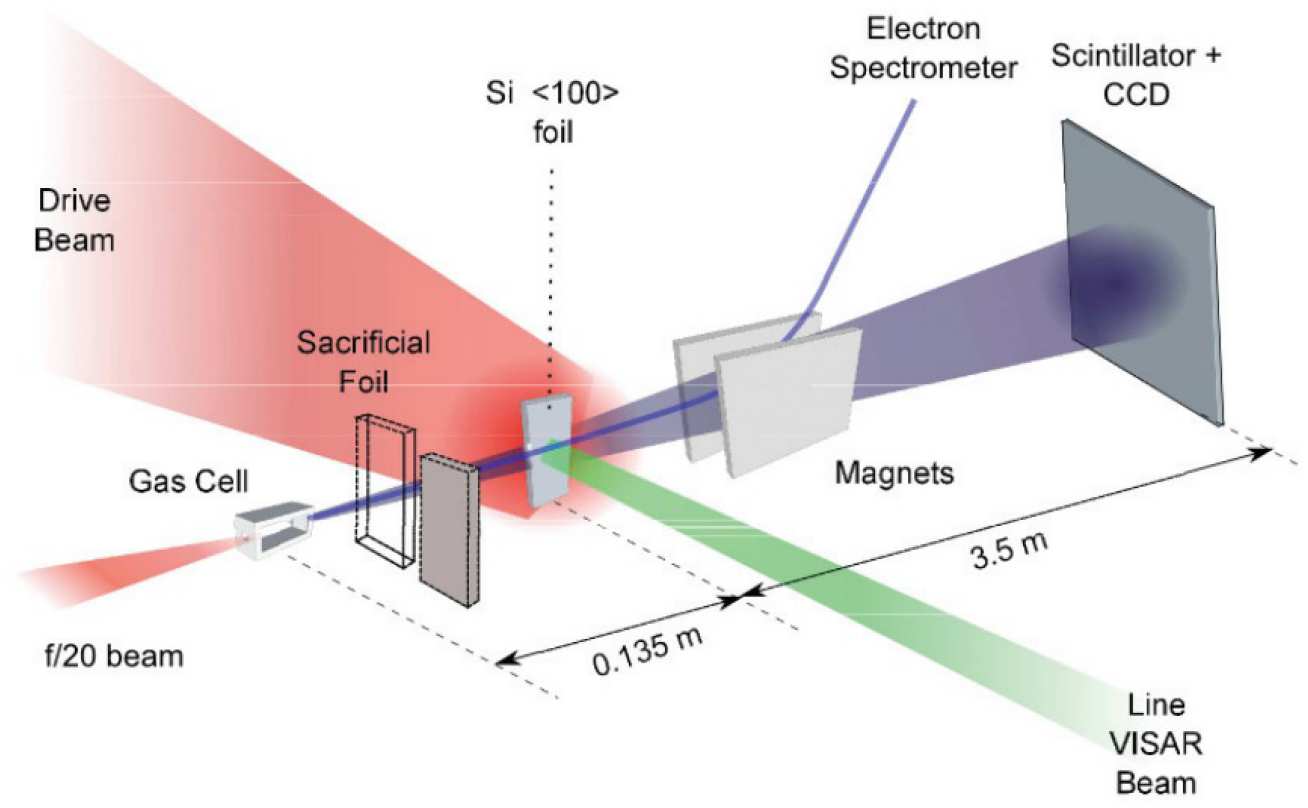
on the I12 beamline at the Diamond synchrotron, and ongoing research collaborations employing ESRF and LCLS, we recently completed proof-of-principle experiments imaging the shock-front evolution in laser driven targets using wakefield betatron X-rays. These world-first experiments were performed on the 400 TW Astra Gemini laser at the Rutherford Appleton Laboratory, UK, as part of an ongoing collaboration between the ISP and the John Adams Institute for Accelerator Science. Shock waves were driven into silicon wafers along the [100] direction, and stroboscopically imaged perpendicular to the shock propagation direction using a ≈40 fs betatron X-ray pulse generated within a laserplasma wakefield. Figure 7 describes the experimental geometry; the uncompressed Gemini north beam (800nm, ≈2ns, 15 J) was used to directly drive a profiled shock front into the silicon wafer while the compressed Gemini south beam (800nm, ≈40 fs, 18 J) was focused in a helium gas cell, generating betatron X-rays (critical energy 34 keV, 2x10⁹ photons per pulse) with a 3-4 micron source size. The radiographs imaging the shock front evolution were captured at a magnification of 26x using a Princeton Instruments PIXIS camera (micro-columnar CsI:Tl scintillator). Figure 6 shows a time-series of radiographs indicating the evolution of the structured shock front as it transits the silicon wafer. Quantitative analysis of these ground-breaking images to reduce for example, single shot Hugoniot data, shocked density, and comparison with radiation Hydrocode simulations is ongoing. Regardless, these initial results showcase a promising, potentially table top sized X-ray source suitable for probing the response of materials under extreme conditions with micron-scale resolution.
Figure 6: (top right) Time-series of radiographs showing the evolution of the shock front. The figure indicates the beam profile used to drive the structured shock waves into the silicon target, each sub figure indicates the time delay from shock drive.
Figure 7: (bottom right) Schematic of the experimental geometry employed at Gemini. Shock waves were driven into the silicon foil at 30 degrees off-normal using the Gemini north beam, while the compressed south beam (f/20) was focused in a helium gas cell generating betatron X-rays. The rear surface of the silicon foil was diagnosed with line-VISAR, while radiographs of the shock front evolution were captured perpendicular to the direction of shock propagation with a magnification of approximately 26x.
High-energy synchrotron X-ray radiography of shock-compressed materials
- Michael Rutherford (PhD Student)
- David Chapman (RA)
- Daniel Eakins

Under the rapidly evolving conditions of shock-compression the interplay between sub-surface processes, such as structural phase transitions, shear localisation and void coalescence, strongly influences the bulk mechanical response of materials. Traditionally, dynamic experiments have been diagnosed with in situ, time-resolved surface measurements, and post-loading analysis. However, these techniques cannot provide an unobstructed view of how fundamental deformation mechanisms translate into bulk behaviour, limiting our ability to design materials with predefined properties from the ground up.
Unlike optical techniques, X-ray radiation offers unimpeded access to in-material quantities such as density and phase composition during dynamic loading. 2014 saw the continued development of a dynamic X-ray radiography capability at Beamline I12 at the Diamond Light Source synchrotron (Rutherford-Appleton Laboratory, UK). Shock waves are driven into materials using the ISP’s portable, single stage gas gun. Following plate impact, material deformation is probed in situ by high-energy (50 – 250 keV) white-beam X-ray radiography and complimentary velocimetry diagnostics. 1 The high energies and large beam size (up to 95 x 30 mm) delivered by Beamline I12 allow the study of appreciable sample volumes (several cm 3 ) of industrially important high-Z materials, such as transition metals.
By combining traditional velocimetry diagnostics with the

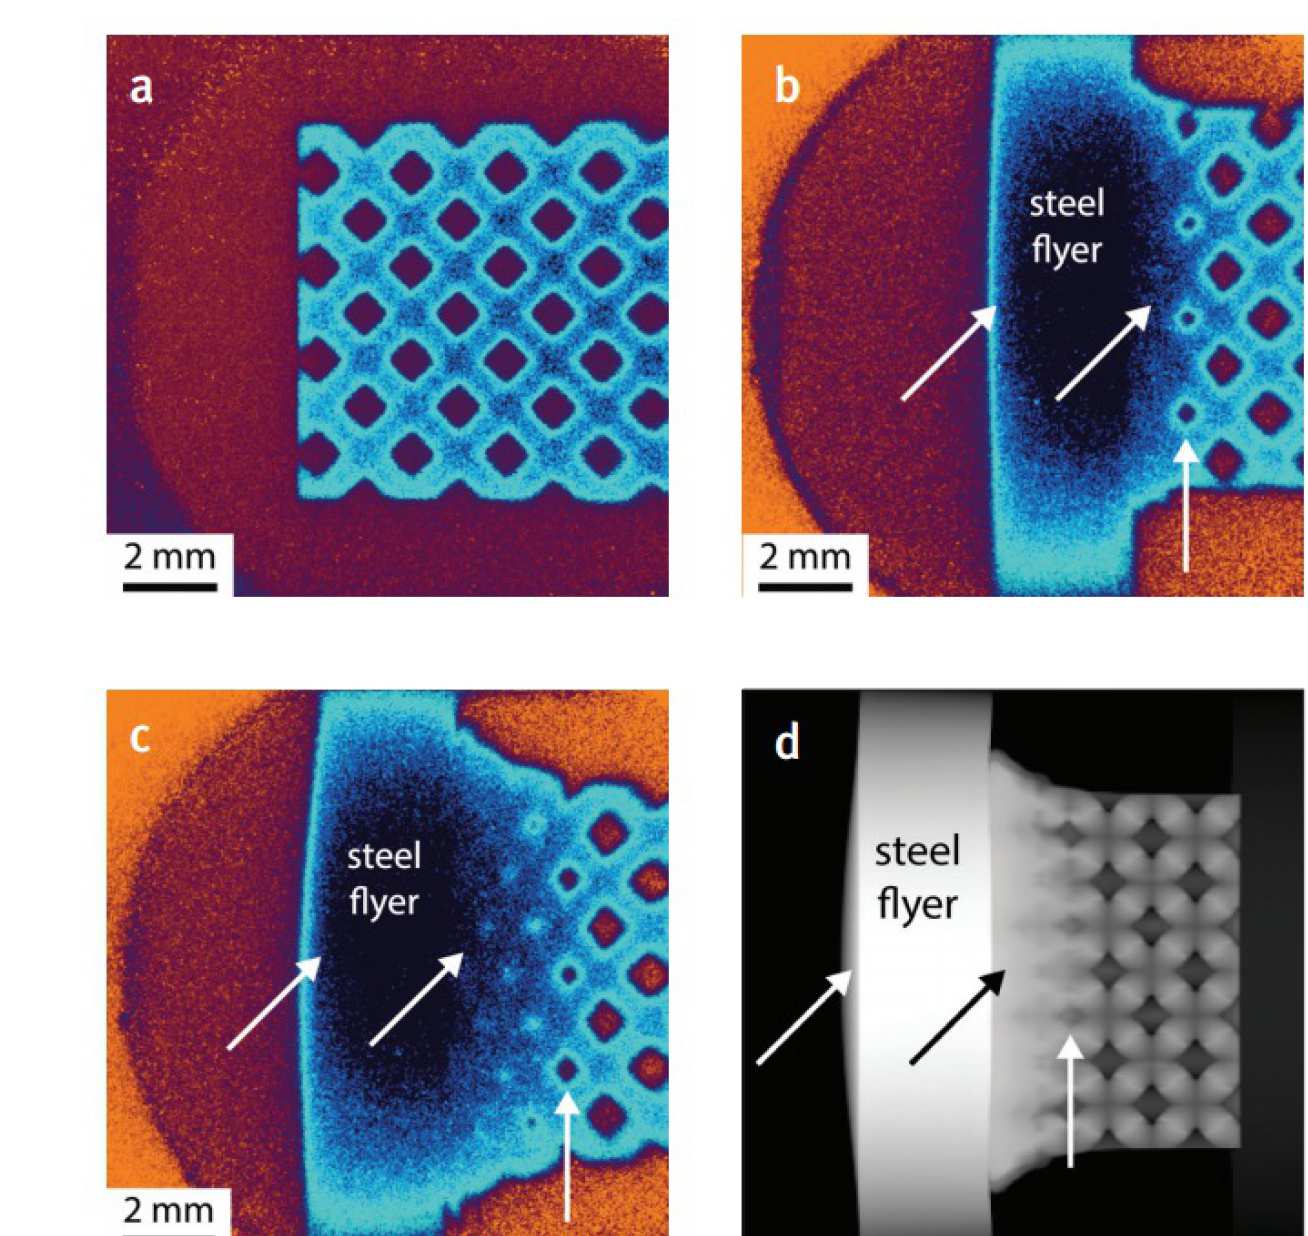
high-resolution in situ X-ray radiography possible with synchrotron radiation, a series of experiments performed in 2014 have provided new insight into the kinetics of spall fracture in Mg AZ31 (a heavily-textured aerospace alloy), the densification process in silicon carbide powder beds, and the development of interfacial structures in compressed SLM steel lattices. In addition to dynamic experiments, sample microstructures were characterised prior to loading with X-ray tomography.
With the intention of extracting quantitative information (e.g. density) from the radiographs, future work will continue to compare the high-resolution experimental radiographs with predicted images produced via 3D hydrodynamic simulations initialised from X-ray tomograms and the MCNP6 code.
Finally, a custom imaging system will permit shorterexposure, higher-resolution imaging, which in combination with new loading platforms (SHPB and a two-stage gas gun) will increase the scope of transient physics accessible at the Diamond Light Source.
Figure 26: The apparatus at Beamline I12, showing the portable gas gun and imaging system. (b) Schematic of the dynamic X-
ray radiography apparatus. Following plate impact, material deformation is probed via X-ray radiography and velocimetry.
Figure 27: (a) Static, pre-shot radiograph of a SLM steel lattice. (b) and (c) Radiographs captured in situ 2.4 μs and 6.1 μs after impact, respectively. White arrows highlight density gradients across the flyer and the development of an interfacial structure at the flyer-lattice interface. Radiographs are shown in false colour to emphasise density contrast. (d) Output of a 3D CTH hydrodynamic simulation 6 μs after impact, shown in terms of areal density.