--tojpeg_1573570450421_x2.jpg)
Multiple independent data sets show that the Earth’s average surface temperature has warmed by about 1.1°C since the start of the Industrial Revolution in 1850. This historic trend of global warming is a clear signal that human emissions of greenhouse gases are changing the planet’s climate. But why exactly is this happening?
This section explains what the greenhouse gas effect is and what it tells us about the impact of human emissions on the planet; how scientists know natural phenomena such as the sun or the El Niño cycle cannot explain climate change; and why humans are causing atmospheric CO2 to reach higher levels than at any point in the last several million years.
FAQs
- How do we know global temperatures are rising?
- How have humans caused global temperatures to rise?
- How do natural factors influence the climate? Can they explain climate change?
- What determines how sensitive the planet’s surface temperature is to increasing greenhouse gases?
- This is not the first time the climate has changed. How do we know we’re not just in a natural cycle between Ice Ages?
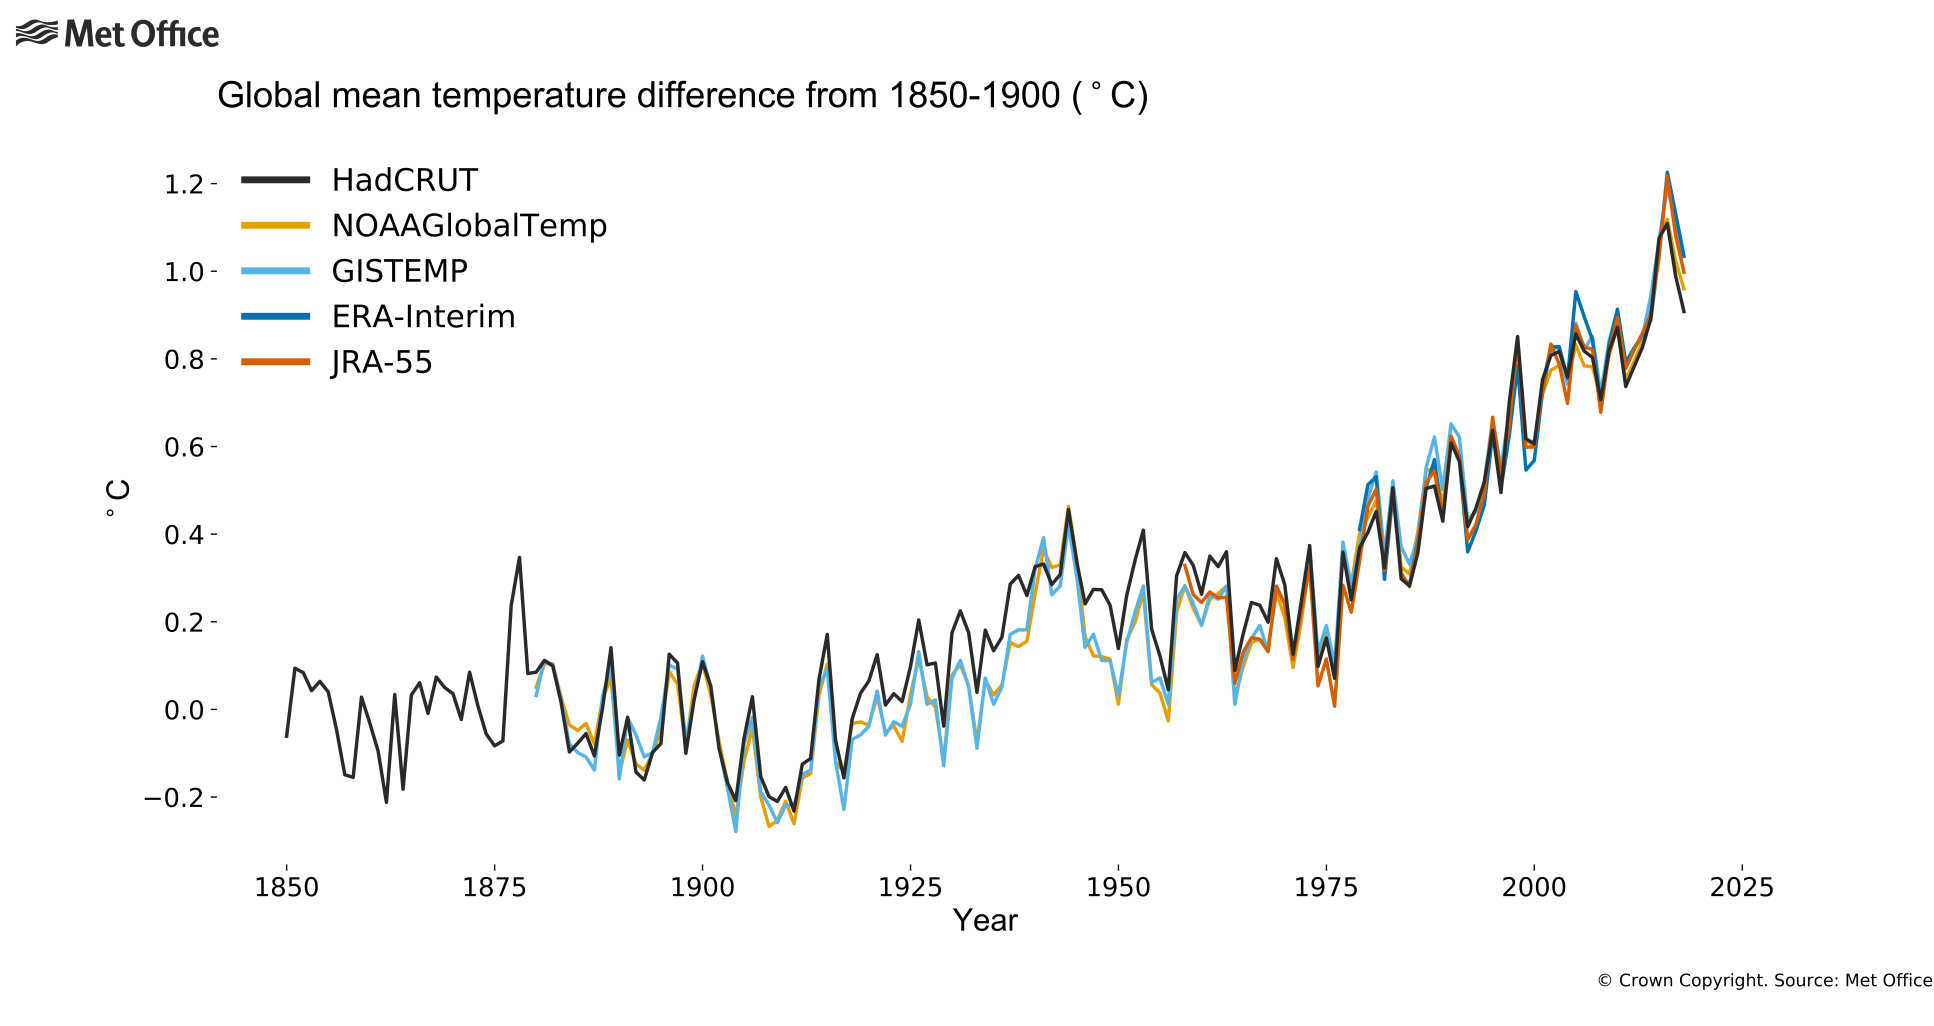
We know that global temperatures are rising because several independent data sets, made up of direct measurements of the Earth’s surface temperature, reveal that globally averaged temperatures have warmed by about 1.1°C since 1850[1].
This warming has not happened in a smooth manner, as there are small variations year on year. The climate system is complex and greenhouse gases are not the only factor that contribute to temperature change. In addition to the impact of human activities on the climate, large amounts of energy move around naturally within the climate system, particularly between the atmosphere and ocean. This affects global temperatures over timescales of years by creating temporary warmer or cooler periods, such as during El Niño events.
However, the long-term temperature pattern since 1850 is clear. The historic trend of atmospheric warming observed for the last 150 years is remarkable and is substantially greater than can be explained by natural variations.
The cause of this temperature rise can be explained physically by the increase in atmospheric CO2 concentrations that have accompanied it. These have risen from 280 parts per million in around 1850, to over 400 parts per million today. This is a clear indication that human emissions of greenhouse gases are responsible for the rise in global temperatures. Natural climate processes could not have caused such a rapid and continued increase in surface temperature[2].
We can be confident in the data. The scientific processes of measuring historical and present-day temperature changes have become more refined and scientists regularly carry out careful quality checks to make sure their observations can be trusted and compared over time.
This includes making corrections to the time series of temperature records to account for variations in the location or environment of an observation station, or changes in the measurement techniques of historic temperature records. This monitoring makes us certain that increasing global temperatures are due to human activities since the industrial revolution, when the burning of fossil fuels started injecting huge levels of greenhouses gases into the atmosphere.
References
[1] IPCC, 2021: Summary for Policymakers. In: Climate Change 2021: The Physical Science Basis. Contribution of Working Group I to the Sixth Assessment Report of the Intergovernmental Panel on Climate Change [Masson-Delmotte, V., P. Zhai, A. Pirani, S. L. Connors, C. Péan, S. Berger, N. Caud, Y. Chen, L. Goldfarb, M. I. Gomis, M. Huang, K. Leitzell, E. Lonnoy, J.B.R. Matthews, T. K. Maycock, T. Waterfield, O. Yelekçi, R. Yu and B. Zhou (eds.)]. Cambridge University Press. In Press.
[2] IPCC. (2013): Summary for Policymakers. In: Climate Change 2013: The Physical Science Basis. Contribution of Working Group I to the Fifth Assessment Report of the Intergovernmental Panel on Climate Change [Stocker, T.F et al. (eds.)]. Cambridge University Press, Cambridge, United Kingdom and New York, NY, US
A
Scientists use a mix of approaches to assess how human activities have caused climate change and the historical temperature increase of about 1.1°C since 1850. One of the techniques is the fundamental physical understanding of the greenhouse gas effect.
Scientists started to understand the greenhouse gas effect from the 1820s, when they realised the presence of atmospheric gases warms the surface of the Earth. Greenhouse gases allow much of the Sun’s radiation to pass through the atmosphere to reach the Earth’s surface, but then stop heat radiation emitted by the warm surface from escaping back to space. Through this process, CO2 and other greenhouse gases raise the average temperature of the Earth’s surface from the -18°C it would be without an atmosphere to around +14°C[1].
CO2 is a potent greenhouse gas that, once injected into the atmosphere, remains and affects the climate system for centuries. Human activities have emitted increasing levels of CO2 since the beginning of the Industrial Revolution. As the concentrations of CO2 and other greenhouse gases, such as methane, increase in the atmosphere, they trap more heat and raise the surface temperature further. This causes global warming.
To understand the effect of human activities in relation to natural variations in the climate system, scientists use complex computer simulations. These models calculate the temperature, wind, humidity and other meteorological parameters that are part of the natural climate system. Comparing the outputs of models that include only natural factors with models that take into account human activities shows clearly that humans have caused climate change. Models only show a temperature change consistent with the warming observed when they include emissions from human activities[2].
This makes it clear that greenhouse gases, emitted through human activities such as industry, transport and agriculture, are the primary cause of global warming since 1850.
References
[1] Andrews, D. R. (2000). An Introduction to Atmospheric Physics. Cambridge University Press, Cambridge.
[2] IPCC (2013). Climate Change 2013: The Physical Science Basis. Contribution of Working Group I to the Fifth Assessment Report of the Intergovernmental Panel on Climate Change. Cambridge University Press, Cambridge, UK and New York, NY
The world’s climate is affected by many different natural processes that have a variety of impacts throughout time. These often influence global surface temperatures for a short while and make some periods either warmer or colder. However, none of these natural factors can explain the long-term trend of global warming that we have observed since 1850 and are seeing today[1].
Volcanic eruptions are known to influence the climate system. They emit aerosols into the high atmosphere, which can block sunlight temporarily and so cool the surface temperature. The clearest example of this effect is the massive eruption of Mount Tambora in 1815, which led to the so-called ‘year without a summer’. However, the impact only lasted for a few years. This would be the case for any new volcanic eruptions as well. While volcanoes also release some CO2, the amount is negligible compared with CO2 emissions from human activities since industrialisation.
The oceans also distribute a huge amount of heat around the world. Every few years, off the west coast of South America, warm water from beneath the ocean surface rises to the top and pours heat into the atmosphere; this phenomenon is known as an El Niño event. This atmospheric heat affects the average temperature of the entire planet, which means the warmest years on record are often associated with the El Niño cycle. However, El Niño events do not explain the warming trend in global average temperature over the past century - they only temporarily elevate global temperatures by a small fraction of a degree.
The sun provides all the energy for the Earth’s climate. This means any changes in its radiative output also have a strong potential to influence global atmospheric and ocean temperatures. Scientists have measured solar radiation using satellites over the past forty years, and have looked at indicators of solar activity over much longer periods in geological data. This evidence shows us that, over the past 10,000 years at least, the sun’s energy has varied by less than one tenth of one percent. This is enough to have caused variations in global temperature of around 0.1°C, but cannot explain the global warming of around 1°C over the past century[2].
These different natural factors play a role in cooling or heating the planet over relatively short periods of time, such as months and years. They cannot explain the warming trend of the past century. This can only be explained by the impact of human greenhouse gas emissions.
Figure: Global temperature difference from the 1890-1919 average
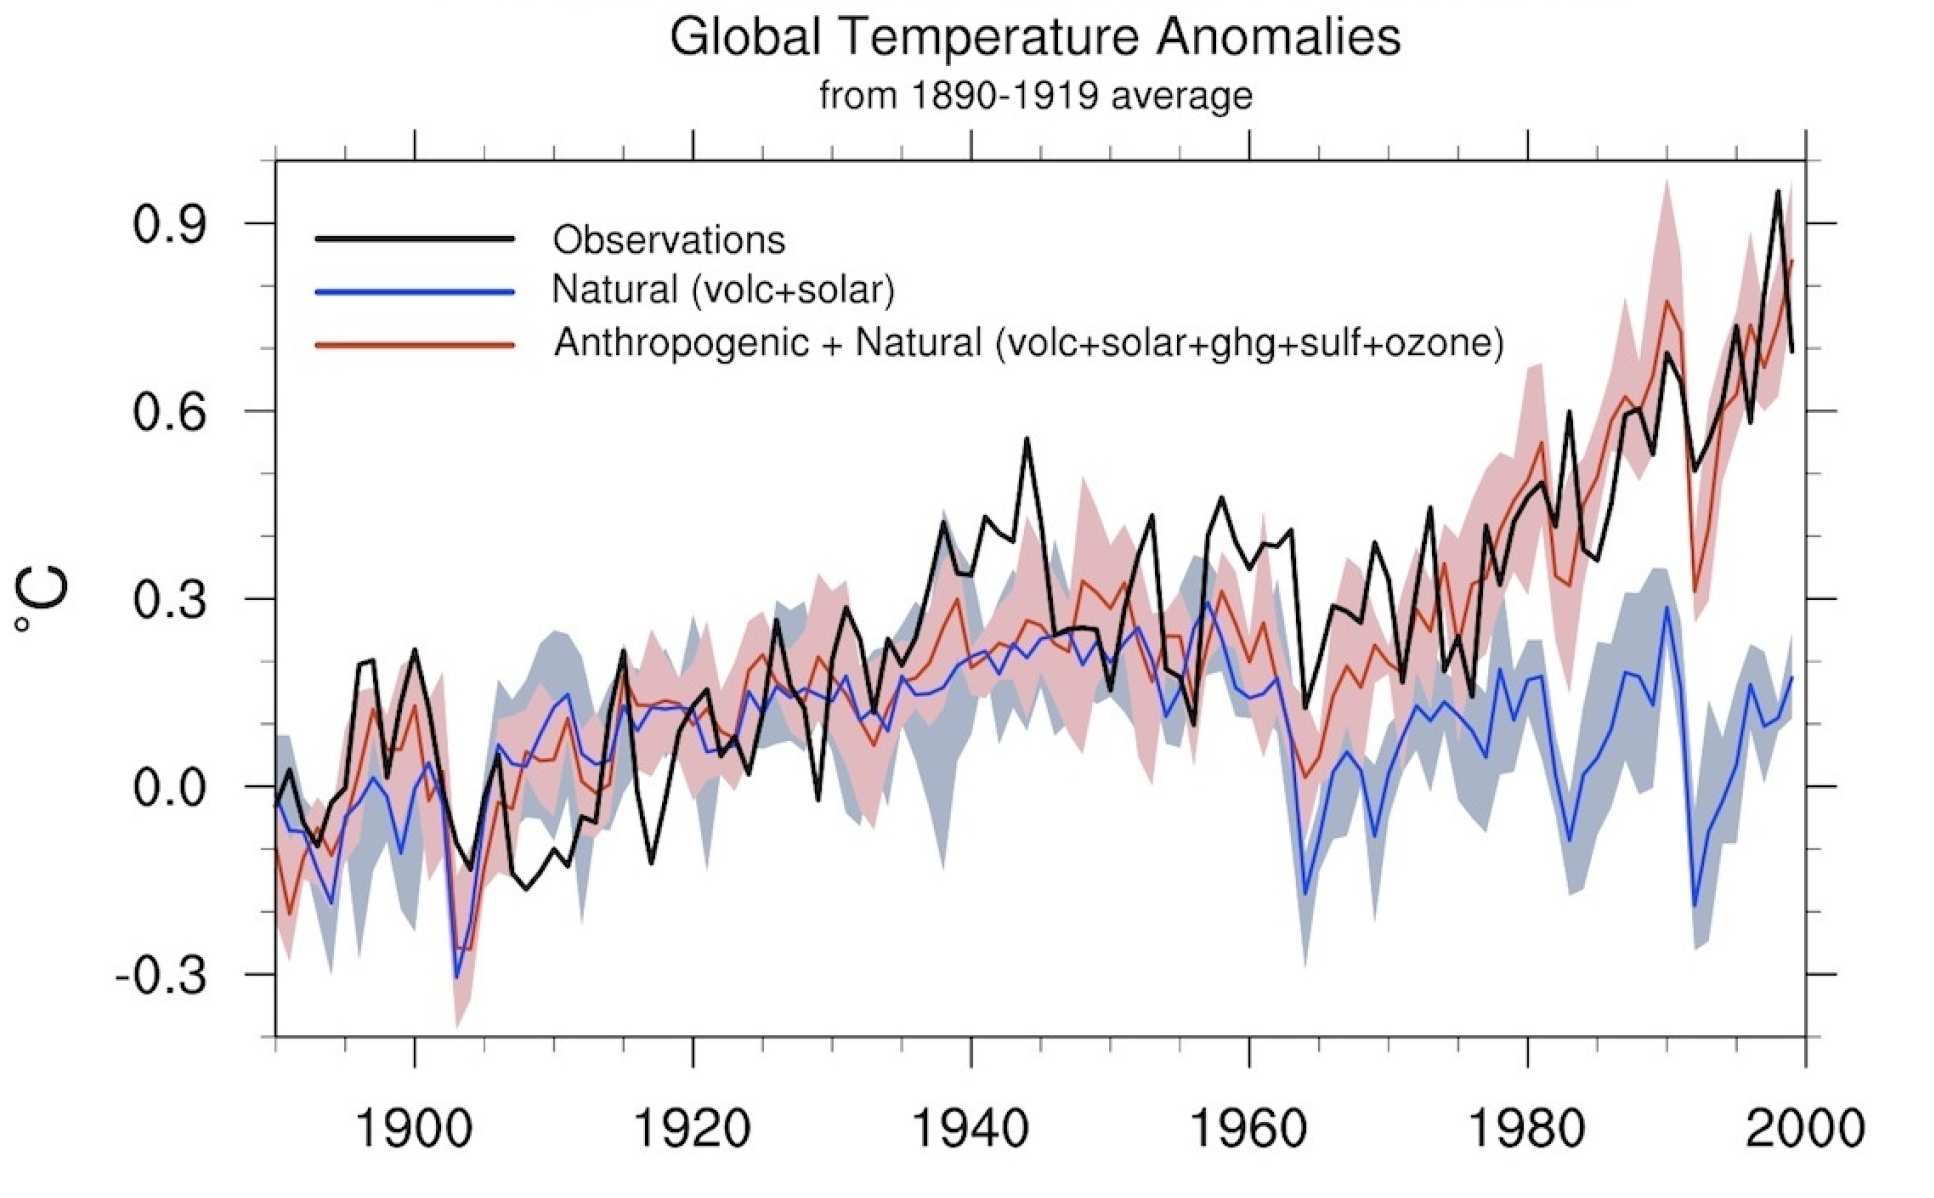
Source: Meehl, G. A., Hu, A., & Santer, B. D. (2009). The mid-1970s climate shift in the Pacific and the relative roles of forced versus inherent decadal variability. Journal of Climate, 22(3), 780 –792. ©American Meteorological Society. Used with permission.
References
[1] IPCC (2013). Climate Change 2013: The Physical Science Basis. Contribution of Working Group I to the Fifth Assessment Report of the Intergovernmental Panel on Climate Change. Cambridge University Press, Cambridge, UK and New York, NY
[2] Vieira, L.E.A. et al (2011). Evolution of the solar irradiance during the Holocene. Astronomy and Astrophysics 531, A6
‘Climate sensitivity’ is the way global temperatures respond to an increase in CO2 in the atmosphere. It helps us understand how much temperatures will rise in response to emissions from human activities. Scientists currently estimate that the climate warms by about between 1.5°C and 4.5°C each time the concentration of CO2 in the atmosphere doubles[1].
Understanding this sensitivity takes into account other processes that can further amplify or diminish how the climate responds to warming following increases in CO2. For example, as the atmosphere warms, its water-vapour content increases. Because water vapour is also a greenhouse gas, it strongly enhances the temperature increase that would come from raised levels of CO2 alone. This is an example of how positive feedback processes amplify the climate’s response to warming from increased CO2 and make the impacts more severe.
Clouds also play an important role in shaping how the Earth’s surface temperature responds to increases in atmospheric CO2. Thick, bright clouds lying over the ocean, particularly in the tropics, enhance the reflection of sunlight back to space, which acts to cool the planet. Thin, high, ice clouds, however, act like greenhouse gases and trap the heat. With increased warming, cloud reflection of sunlight is expected to decrease, while the cloud greenhouse effect will increase. These changes indicate that clouds play an important role in amplifying the effect of global warming, although their precise effects remain uncertain.
Another important process that influences climate sensitivity concerns ice caps, sea ice and glaciers. With their white, bright surfaces, snow-covered areas, they reflect sunlight away from Earth and cool it. However, as temperatures rise, snow and ice is melting in places like the Arctic. As snow cover decreases, it exposes water or land, which, because it is darker and so much less reflective, absorbs more sunlight. This is another positive feedback that amplifies global warming[2].
References
[1] IPCC. (2013): Summary for Policymakers. In: Climate Change 2013: The Physical Science Basis. Contribution of Working Group I to the Fifth Assessment Report of the Intergovernmental Panel on Climate Change [Stocker, T.F et al. (eds.)]. Cambridge University Press, Cambridge, United Kingdom and New York, NY, USA
[2] IPCC. (2013). Climate Change 2013: The Physical Science Basis. Contribution of Working Group I to the Fifth Assessment Report of the Intergovernmental Panel on Climate Change. Cambridge University Press, Cambridge, UK and New York, NY
Ice Ages happen when CO2 levels in the atmosphere are around 180 parts per million. The cyclical warmer periods in between Ice Ages – known as interglacial periods – happen at around 280 parts per million. This has been the case for all Ice Age cycles over the past 800,000 years; as far back as scientists have measurements from ice cores, in fact. Today, however, emissions from human activities have caused atmospheric CO2 levels to reach around 410 parts per million; far above the level for being a natural warm period within these 800,000 years, and it is still rising.
Ice Ages are triggered and paced by changes to incoming solar radiation, as variations in the Earth’s orbit change the way the Sun’s energy is distributed. In the Northern Hemisphere, the difference between summer and winter insolation – the amount of sunlight that reaches Earth – varies over cycles of 100,000, 40,000 and 21,000 years. When summer solar radiation is reduced, summer warming is unable to melt the snow that has built up over the previous winter. This kick-starts the process that leads to an Ice Age – which last happened on Earth about 20,000 years ago.
These natural variations in solar radiation are subtle, and scientists know they are too weak to build an Ice Age by themselves. However, their effect is amplified by feedback loops that make them stronger. For example, when the Earth’s surface turns white due to increased snow and ice cover, it becomes more reflective and so cools the planet further. Variation in CO2 levels is also an important feedback loop in creating an Ice Age. Part of this feedback loop relates to changes in how much CO2 the ocean stores.
As the polar oceans cool, they become more productive. This is because cooler surface water is less buoyant than warm water, and so encourages nutrient-rich subsurface water to ‘upwell’ into the surface layer of water – the ‘sunlit zone’. Nutrient-rich water absorbs more atmospheric CO2 into the shells and bones of marine creatures and plants. This reduces the amount of CO2 in the atmosphere and amplifies the cooling of the Earth further. As the Earth’s orbit around the Sun shifts and the summers become warmer, the ice begins to melt and the opposite process occurs, leading to global warming.
The pace of today’s rise of CO2 levels in the atmosphere is much faster than for any glacial cycle. In the last 60 years alone, emissions from human activities using fossil fuels have caused CO2 levels to increase by about 100 parts per million, taking us to 410 parts per million in total. It took 10,000 years for CO2 levels to increase by 100 parts per million naturally, following the last Ice Age.
The amount of CO2 in the atmosphere is also higher than at any other point in human history. The last time the world had a CO2 concentration of 410 parts per million was between 5.0–3.5 million years ago, when the world was 3–4 degrees warmer than today. Greenland and West Antarctica were free of ice and sea levels were 15–20 metres higher than today.

Read more about these topics by exploring our background briefings:
Find more FAQs
To read more explainers on climate change economics and finance, energy policy and international climate action, see the FAQs published by the Grantham Research Institute at LSE.