Fluorescence is the phenomenon whereby a sample absorbs incident photons (such that electrons are excited to a higher energy level) and emits photons (fluorescence) at a longer wavelength. Many naturally occurring molecules are inherently fluorescent – these are described as fluorophores. However, most biological molecules do not fluoresce in the visible spectrum and often biological molecules such as proteins, are labelled with a convenient fluorophore tag that is readily excited by visible light sources and can be directly viewed or detected using a camera. These fluorescent tags are often based on dye molecules that can be chemically attached to biological molecules of interest with great selectivity. By labelling different species of biological molecule with different colour tags, different biological molecules can be distinguished – thus fluorescence provides optical molecular contrast. Some biological molecules are themselves inherently fluorescent and the emission of these endogenous is fluorophores termed autofluorescence. Fluorescence metrology and imaging can provide a means to detect and map specific fluorophores (and therefore the molecules to which they are attached) and it can provide information about the local environment of the fluorophore where this changes the fluorescence parameters. Thus the fluorophores can serve as sensors of their environment, and can be engineered to provide readouts of specific chemical analytes, such as calcium or oxygen concentration, or of physical parameters such as temperature or viscosity.
Fluorescence-based techniques can be used for single point measurements of homogeneous samples, for example in fluorometers that measure the properties of solutions in cuvettes or in optical fibre-based probes, or fluorescence contrast can be exploited for imaging in microscopes, endoscopes or tomographic imaging instrumentation. The fluorescence signal can be characterised with respect to excitation and emission wavelength, fluorescence lifetime and polarisation. The wavelength of the fluorescence is widely used to distinguish between different molecules in a sample and the efficiency of the fluorescence process can be studied to provide information about the local environment of the fluorescent molecules (fluorophores) and therefore of the proteins to which they are attached. The latter is usually parameterised by the quantum efficiency, h, which is the probability that an absorbed photon will result in an emitted fluorescence photon. This can vary according to how the fluorophore environment affects the radiative decay rate, Γ, which is generally a function of the electronic energy level structure of the fluorophore, and the non-radiative decay rate, k, which is a function of interactions of the fluorophore molecules with their local environment. For some fluorophores Γ andkare sensitive to chemical environmental parameters, such as pH or calcium ion concentration, or to physical factors such as the viscosity or temperature.
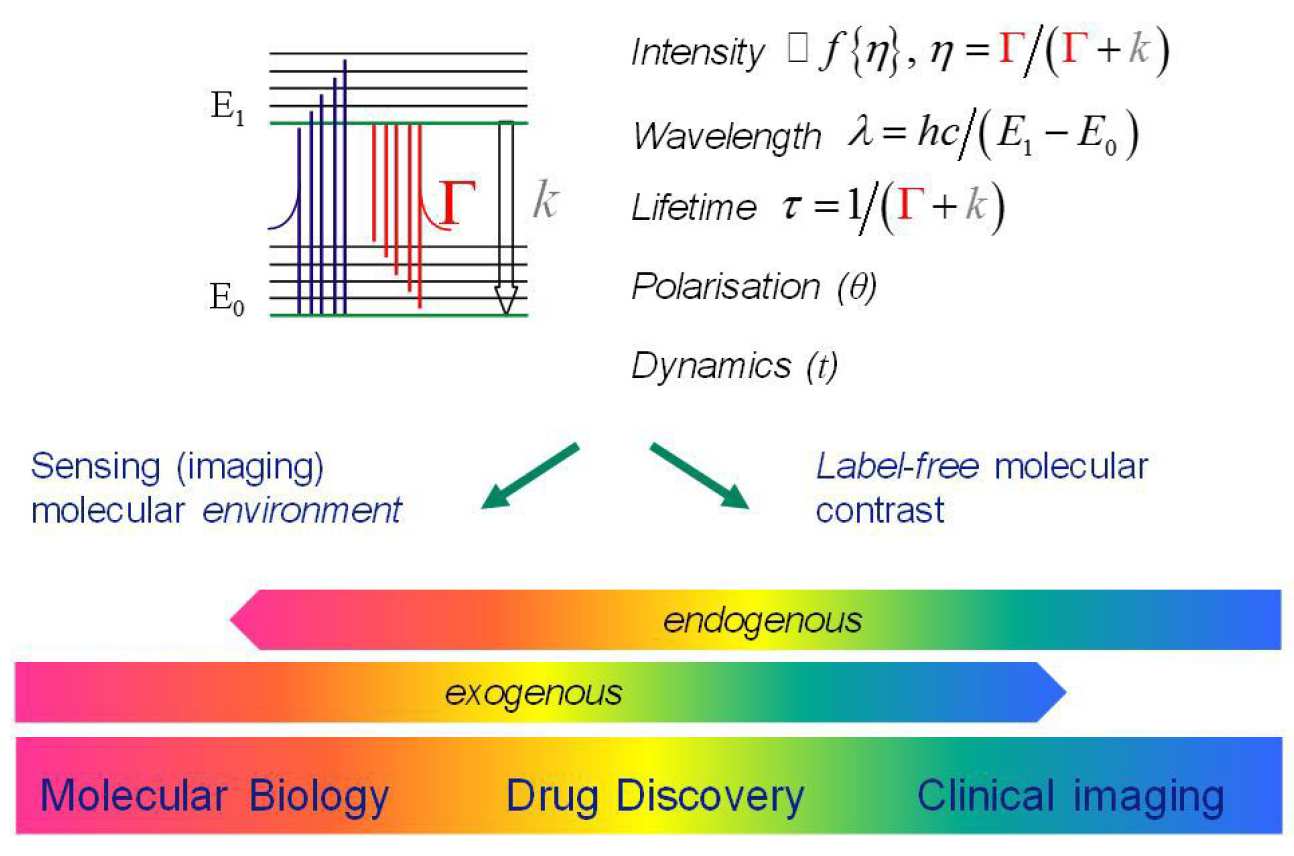 As well as exploiting the wavelength dependence of fluorescence, it is also possible to use the fluorescence lifetime, τ, which is the timescale over which fluorophores relax back to the ground state following excitation, to identify or distinguish between different fluorophore molecules, or to image perturbations in the local fluorophore environment. Determination of fluorescence lifetime is inherently ratiometric, requiring only relative measurements of the temporal decay of the fluorescence intensity after excitation and is independent of fluorophore concentration or of the excitation or detection efficiency. Fluorescence lifetime imaging (FLIM) entails determining the fluorescence lifetime, τ, for each pixel in the field of view and can be used instead of wavelength ratiometric imaging – or the two approaches may be combined. FLIM is useful when there is no suitable wavelength-ratiometric probe available – as is often the case – and is increasingly used to obtain information from the emission of naturally occurring fluorophores in biological samples. It can be used to distinguish different fluorophores according to their lifetimes and also to achieve contrast derived from variations in the local fluorophore environment via their impact on the radiative or nonradiative decay rates. The fluorescence lifetimes of biological fluorophores range from a few picoseconds to nanoseconds and most commonly used exogenous fluorescence probes exhibit nanosecond lifetimes. Fluorescence lifetime measurements can be combined with spectrally resolved measurements, e.g.1,2, to provide enhanced contrast between fluorophores or richer information about fluorophore environment.
A further ratiometric measurement that can provide information from the fluorescence signal is polarisation. Since the efficiency of excitation depends on the cosine of the angle between the polarisation of the excitation light and the dipole of the fluorophore, measurements of the degree of polarisation of the fluorescence, known as the fluorescence anisotropy, can provide information concerning molecular orientation and time-resolved measurements can report on the rate at which the fluorophore orientation changes – which is typically due to collisions with solvent molecules and occurs on timescales of picoseconds to nanoseconds. Thus polarisation-resolved fluorescence lifetime measurements can be used to quantitate the rotational correlation time of fluorescing molecules (i.e. the average time for their orientation to be randomised), which can report on variations in local solvent properties or in the fluorophore size – and therefore the formation of complexes3.
There is an increasing trend to map such spectroscopic measurements of fluorescence in microscopes to realise multidimensional fluorescence imaging (MDFI), resolving fluorescence with respect to parameters such as excitation and emission wavelength, lifetime and polarisation as well as two or three spatial dimensions and elapsed time. Such high content imaging has been enabled by the progress in laser and photonics technology, including robust tunable and ultrafast laser excitation sources, relatively low-cost high speed detection electronics and high performance imaging detectors. The multidimensional data sets can be very large and increasingly advanced software tools and powerful computers are required to extract useful information from this data.
1 Bird, D. K., Eliceiri, K. W., Fan, C. H. and White, J. G., Applied Optics, 43 (2004) 5173
2 De Beule, P., Owen, D. M., Manning, H. B., Talbot, C. B., Requejo-Isidro, J., Dunsby, C., McGinty, J., Benninger, R. K. P., Elson, D. S., Munro, I., Lever, M. J., Anand, P., Neil, M. A. A. and French, P. M. W., Microscopy Research and Technique, 70 (2007) 481
3 Jameson, D. M. and Ross, J. A., Chemical Reviews, 110 (2011) 2685