There are a number of things we have to consider when presenting charts in an accessible way. This includes:
- Line colours
- Alternative text descriptions
Line colours
For people with red green colour blindness, it is important to not have both red and green chart elements (lines, bars or segments). You can easily fix this by changing one of these to an alternative colour.
Adding alt text description
Because charts are providing information it is important to have a text alternative to the chart so that everyone can easily get the same information. From an accessibility point of view, charts are another type of image, but are typically more complex as they are a visual representation of data and trends.
You can add alt text to you Word, Excel or PowerPoint charts in exactly the same way as described on the Add alternative (alt) text to images guide.
You can also access the alt text options by going to Format Chart Area > Chart Options > Layout & Properties.
Writing alt text descriptions
For fairly simple charts, like the one below:
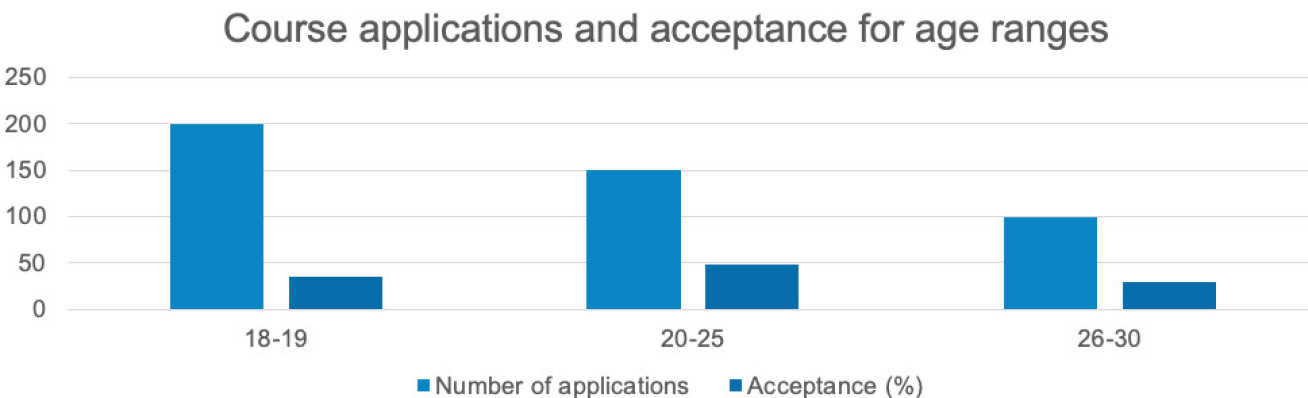
You would say something like:
"For 18-19 year olds there were 200 applications with an acceptance rate of 35%. For 20-25 year olds there were 150 applications with an acceptance rate of 48%. For 26-30 year olds there were 100 applications with an acceptance rate of 29%."
If you have a complex chart that cannot be explained in a couple of sentences, then you do not necessarily need to describe each data point. But, you should summarise the main points or trends that the chart shows. This will mean that a screen reader user will get the main information of the chart.