Construction of Pourbaix diagrams
What is a Pourbaix diagram, and why does it matter for electrodeposition?
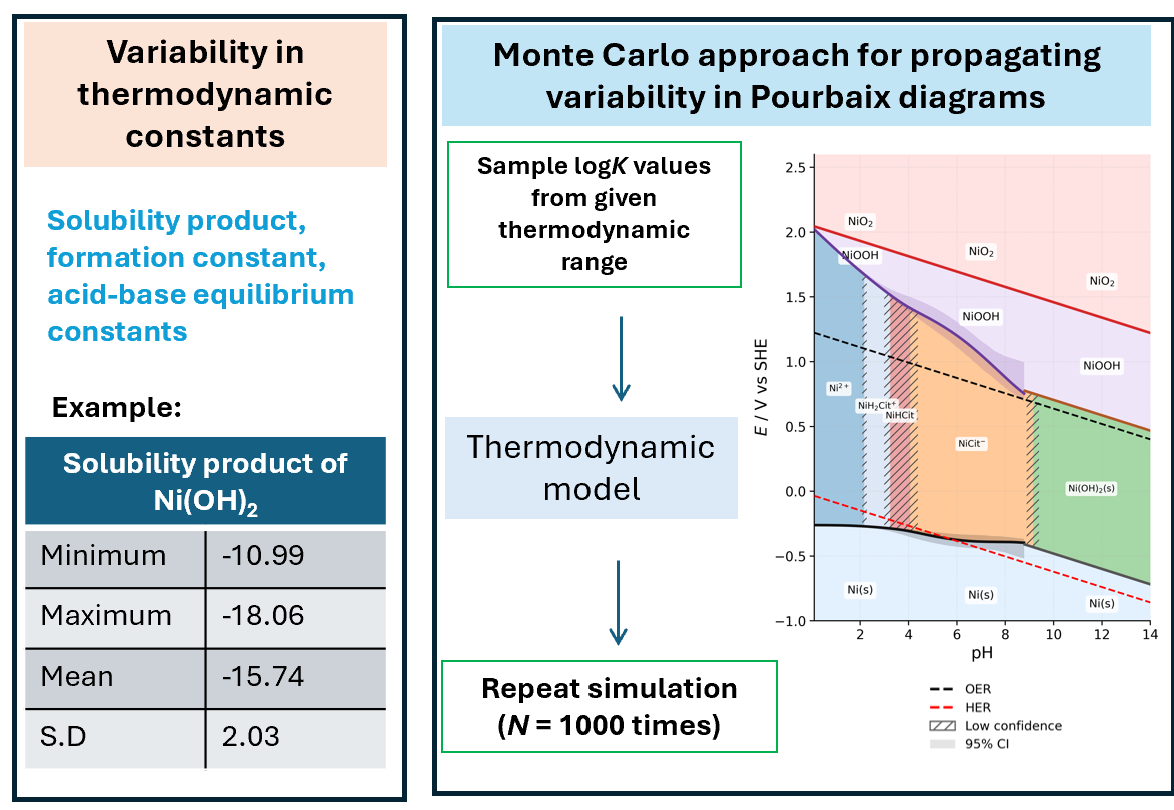
A Pourbaix (potential–pH) diagram maps the most stable species of an element as a function of electrode potential and pH. It shows whether a metal will corrode, passivate or deposit.
Example of Ni electrodeposition
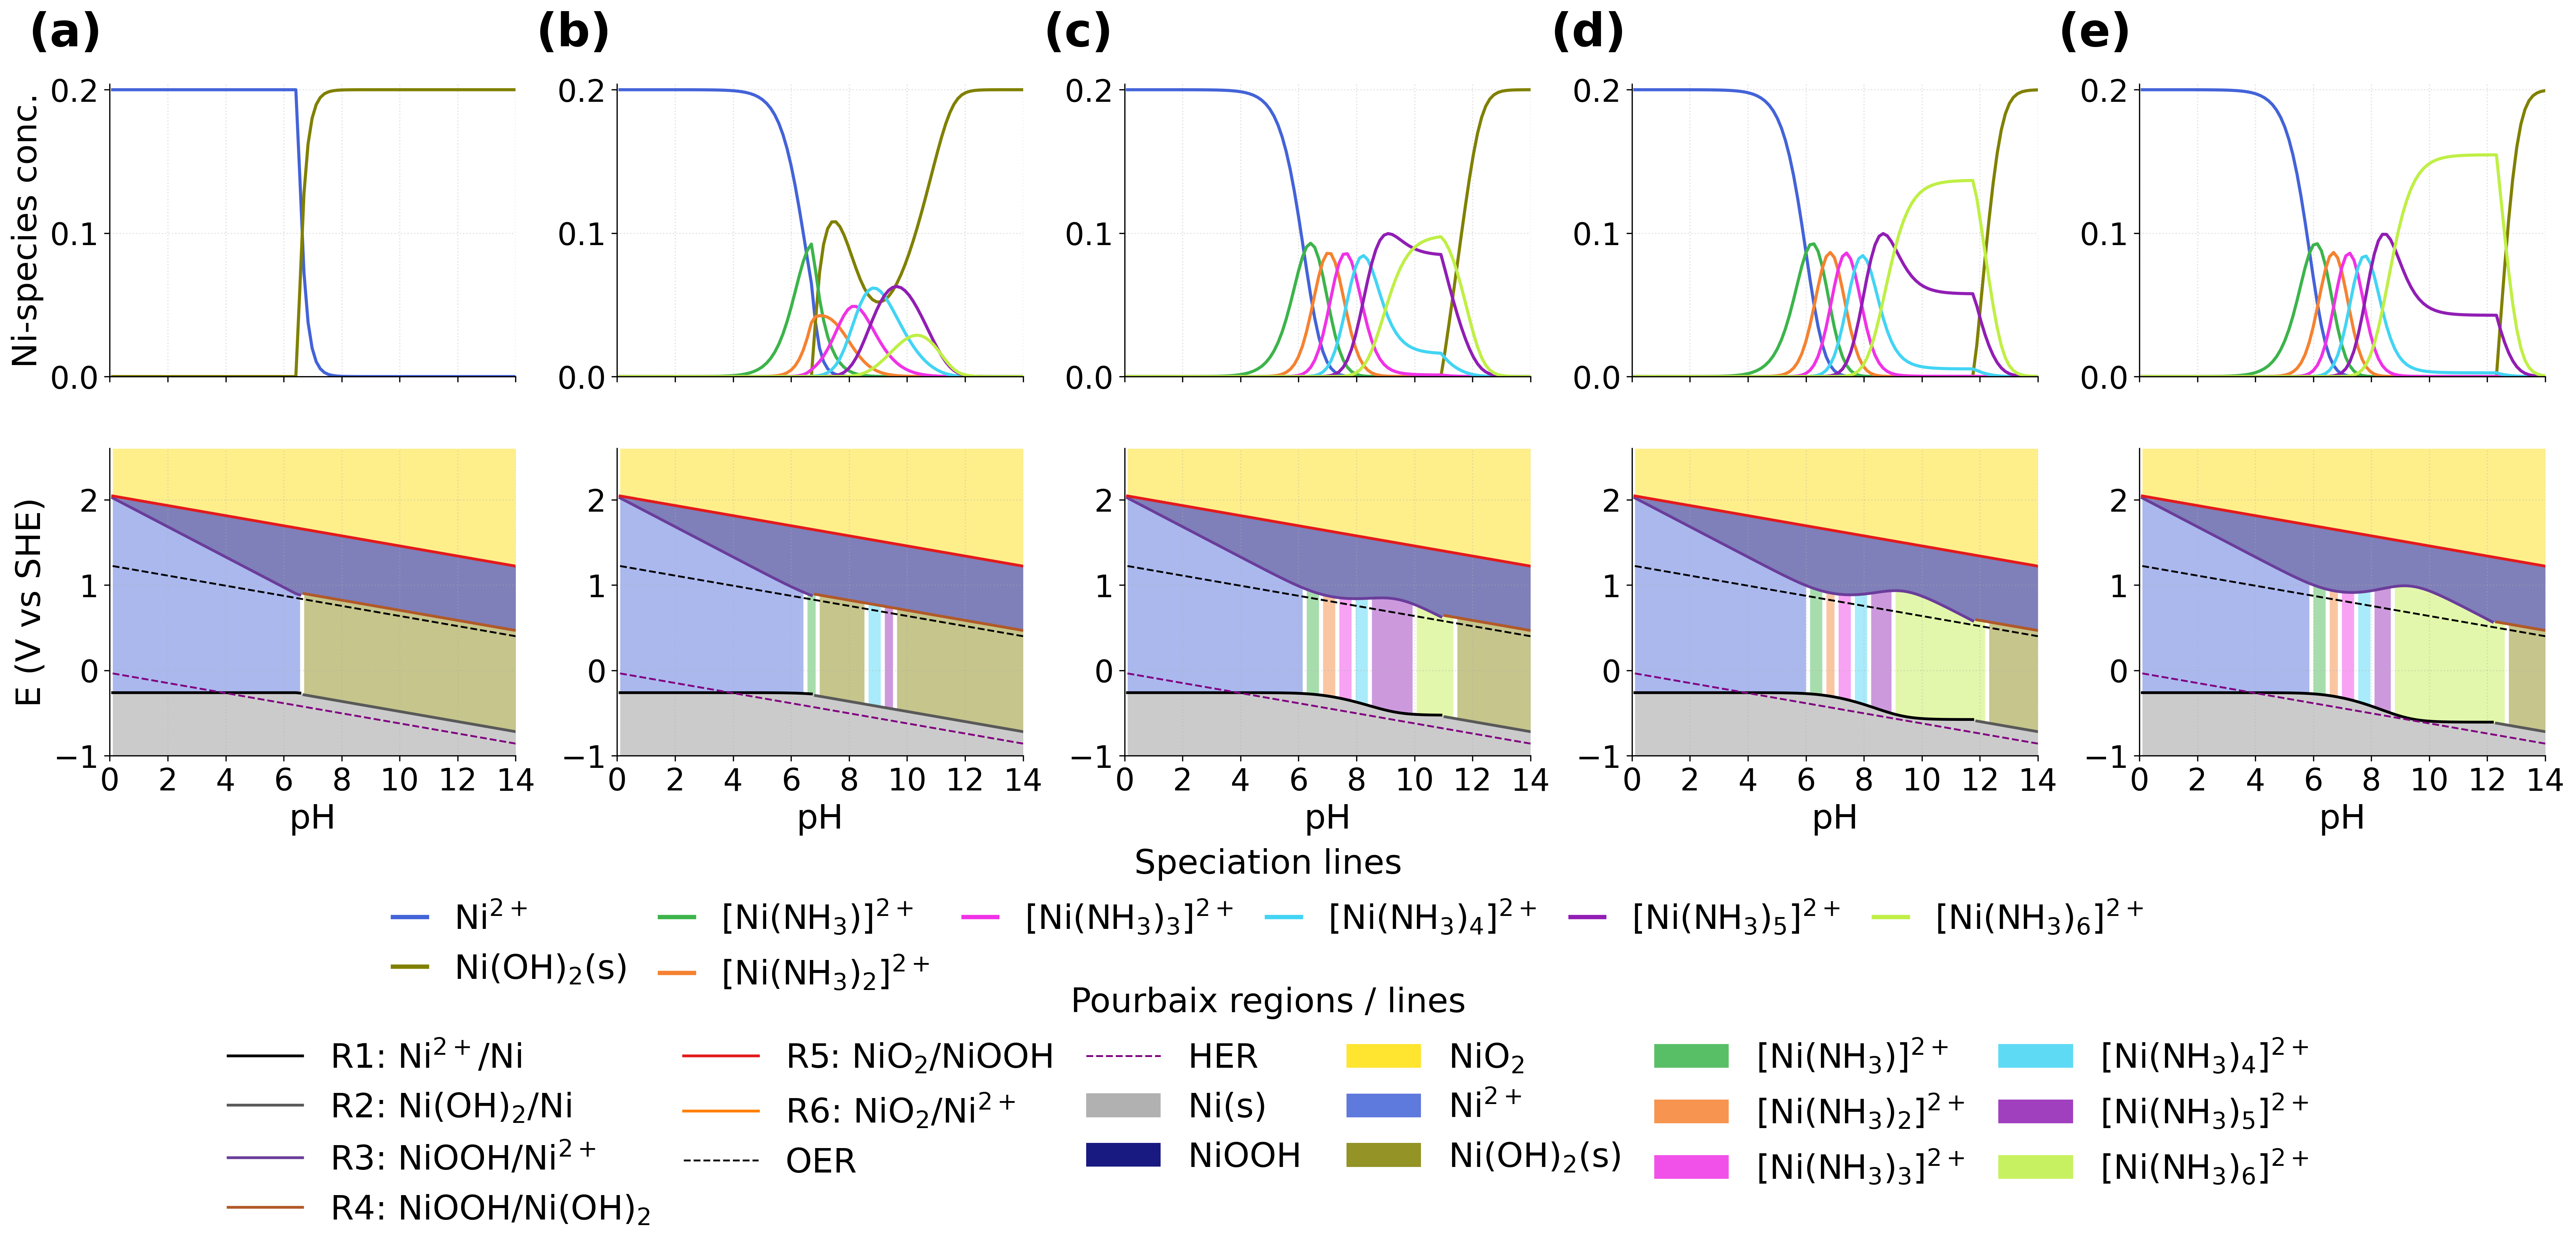
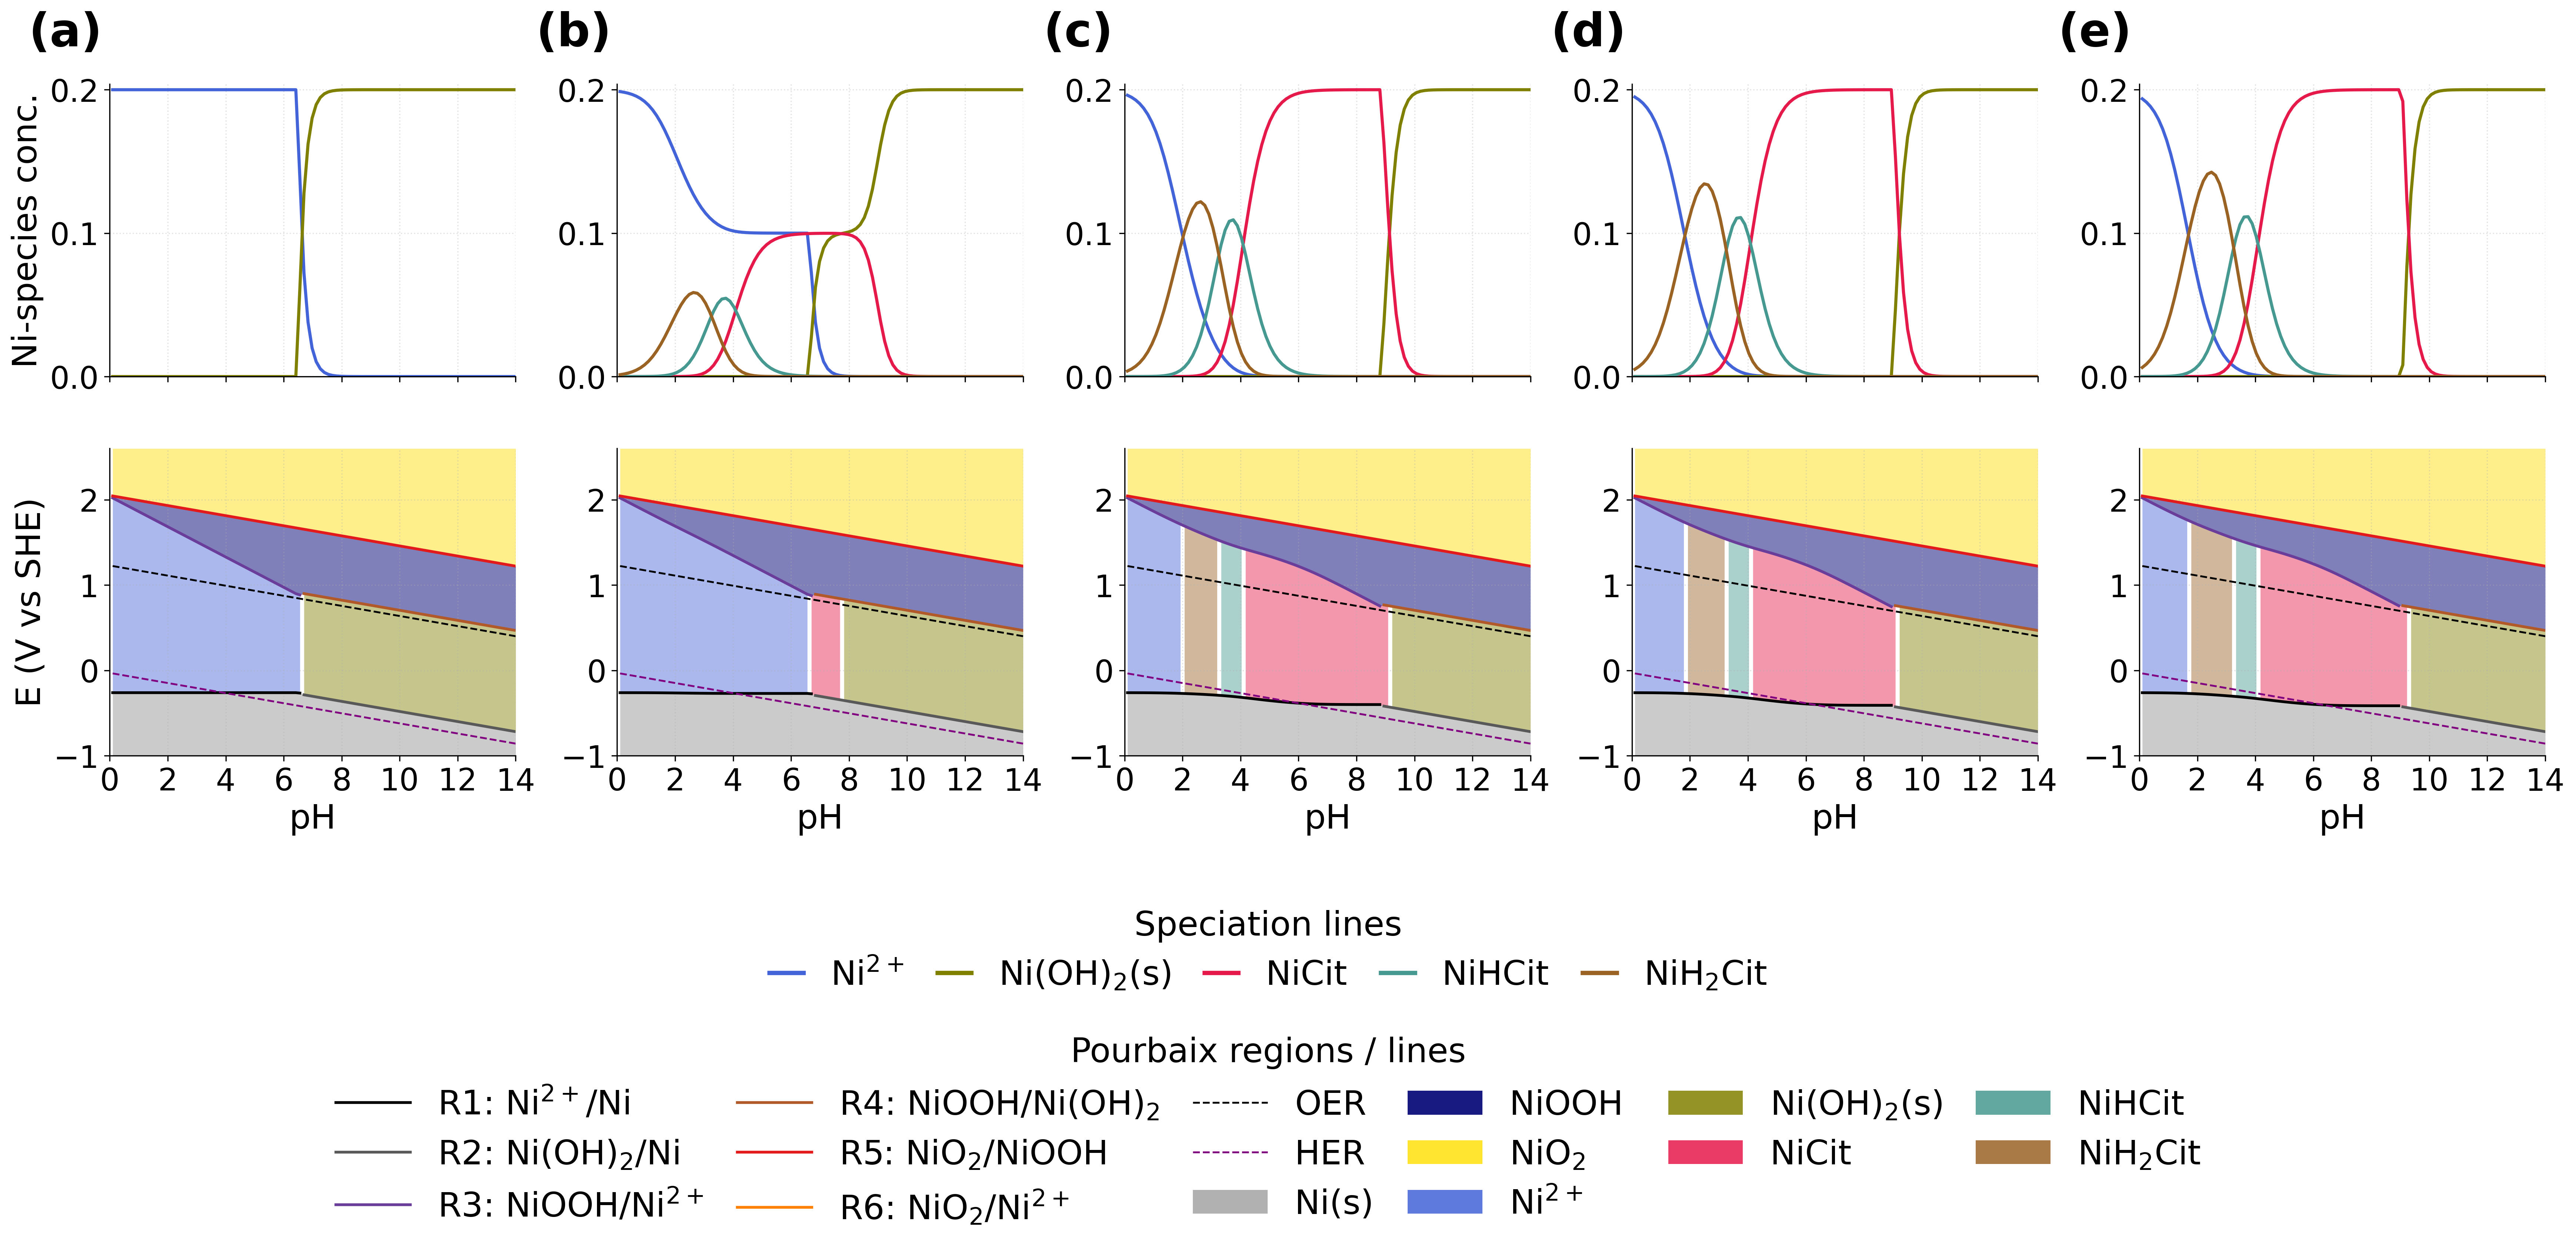
For aqueous nickel electrodeposition, it defines a narrow operating window. At low pH, hydrogen evolution competes with nickel deposition and reduces current efficiency. At high pH, insulating nickel hydroxide forms on the cathode and blocks further deposition. Complexing agents such as ammonia and citrate are added to baths to widen this window and to tailor deposit morphology. Constructing Pourbaix diagrams to include the influence of complexing agents offers a direct route to designing electrodeposition baths, showing how ligands such as ammonia and citrate widen the window in which the metal stays in solution.
How do we construct Pourbaix diagrams for electrolytes with complexing agents?
Conventional constructions assume a fixed concentration of dissolved species, typically 10-6 M. In a bath containing ligands, however, the activity of the free metal ion changes continuously with pH as complexes form and dissociate. We therefore couple a full multicomponent speciation model to the Nernst equation. At each pH we solve the mass balances on metal, ligands and protons, including a saturation constraint for hydroxide precipitation. The activities of the resulting species then set the electrochemical boundaries.
The diagrams show features stability regions for successive metal–ligand complexes, curved Nernst lines where complexation varies with pH, and precipitation boundaries that shift by several pH units with ligand loading. In the nickel system, citrate delays Ni(OH)₂ precipitation to pH 9.3 at a citrate-to-nickel ratio of only 2.5. Ammonia pushes it to pH 12.7 at a 20:1 ratio.
xsxsx
Why should a Pourbaix diagram be probabilistic?
Every boundary on a Pourbaix diagram rest on equilibrium constants measured by potentiometry, spectrophotometry or NMR. These constants are strictly valid only at the ionic strength and temperature of the original experiment, and reported values often differ widely. For β-Ni(OH)2, for example, log Ksp ranges from about −15.0 to −18.5. A deterministic diagram hides this spread behind sharp lines.
We treat each equilibrium constant as a distribution centred on its literature value and propagate the variability through the speciation model by Monte Carlo simulation. The result is the first probabilistic Pourbaix diagram that includes complexing agents. It separates regions of high thermodynamic confidence from regions of genuine ambiguity.
Where next? Towards a unified probabilistic database...
The framework is not specific to nickel. Our next aim is to extend it to other metals (for example cobalt, copper, zinc and iron) and to a wider range of complexing agents used in plating, recycling and corrosion (for example EDTA, glycine, tartrate, gluconate and chloride). Alongside this, we are building a unified, open database of equilibrium constants. Each constant will be recorded with its reported uncertainty and the conditions under which it was measured, such as ionic strength, temperature and method.
Equilibrium constants are scattered across decades of literature, in tables, figures and supplementary files, often in inconsistent units and conventions. Collecting them by hand does not scale beyond a few systems. We are therefore exploring how large language models (LLMs) can be used to extract these values automatically from published papers, together with the experimental conditions and uncertainties that come with them. Each extracted value will keep a link to its original source, and automated checks and expert review will flag entries that are inconsistent or physically implausible. The aim is a database that is both comprehensive and traceable, so that every boundary on a probabilistic Pourbaix diagram can be traced back to the measurements behind it.
Publications
Probabilistic Pourbaix diagrams with complexing agents: A case study of an aqueous nickel–ammonia–citrate system - M. Sharma Timilsina, I. Holmes-Gentle, I.E.L. Stephens and A. Hankin, Electrochim. Acta, 2026, 576, 149607.
Code and data
github.com/manishsharmatimilsina/Probabilistic_Pourbaix_Diagram