Understanding uncertainty and the value of visualisation in AI
Maths PhD student, Alex Terenin, recently presented his group’s work at the 2021 International Conference of Artificial Intelligence and Statistics.
AISTATS is a prestigious event that brings together researchers from the machine learning and statistics communities. One of the group’s papers, Matérn Gaussian Processes on Graphs, won the Best Student Paper award at the event – congratulations!
We caught up with Alex to find out more about his experience at the conference and as a PhD student at Imperial, why he’s fascinated with research into uncertainty, and to get his thoughts on why the visual aspect of machine learning is vital.
Hi Alex, tell us more about your research – what questions are you trying to answer?
My research focuses on artificial intelligence, particularly on learning-based decision-making systems. Such systems are generally built to perform a particular task without precise knowledge of how to do it. On the one hand they need to perform as well as possible given current knowledge at a given time, while on the other hand they also need to try new things in order to explore and gather more data to improve future performance. To balance these factors the learning system needs to understand uncertainty. I study learning systems that can understand and propagate uncertainty.
Congratulations to your group for winning an AISTATS award for your paper, Matérn Gaussian Processes on Graphs - what was it about?
One of the fundamental tools used for building decision-making systems that understand uncertainty is called a Gaussian process. One can think of a Gaussian process as a collection of random curves – this distribution possesses both a notion of an “average curve” as well as “error bars” around the average curve. We can update the curve based on data points, which cause the error bars to shrink when data is introduced into the system. It’s a process that’s very easy to visualise: in the following video, we show the system being trained to adapt its error bars to the shown data.

Similarly, uncertainty can grow with error bars becoming wider if we look at a different location where there is no data. These error bars are then used by an upstream decision-making algorithm. This description gives us a Gaussian process which, for each curve in the distribution, takes in a number and gives you back a number. For any two input numbers, their respective output numbers - and thus means and error bars - will depend on how similar or different the input numbers are.
In this work, we consider the extended case where instead of taking in numbers as input, the Gaussian process takes in nodes on a weighted undirected graph. A graph is finite collection of points, called nodes, and a set of lines which connect some of those points, called edges. Edges can be weighted to signify importance. The Gaussian process, for every random mapping in the distribution, takes in nodes on the graph, and gives you back a number. The similarity between output numbers now depends on how close to or faraway from each other the nodes are in the graph, reflecting its structure and connectivity.
The research images look fascinating – what do they show?
Traffic provides a simple, illustrative example. The graph is given by the road network: nodes are certain points on the map, and edges are roads between those points. Two sides of a street are represented by separate edges. We plot the Gaussian process’ average value by displaying a colour on each node. We plot its error bars by creating a second plot, where the width of the error bars is represented by the node’s colour.
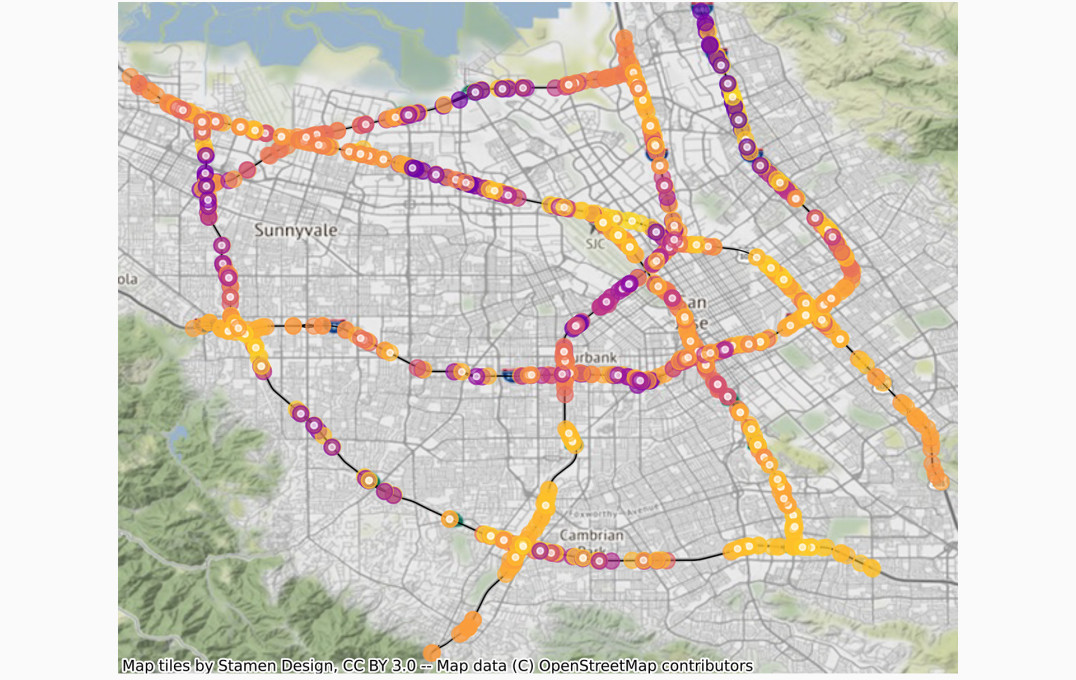
Mean: global
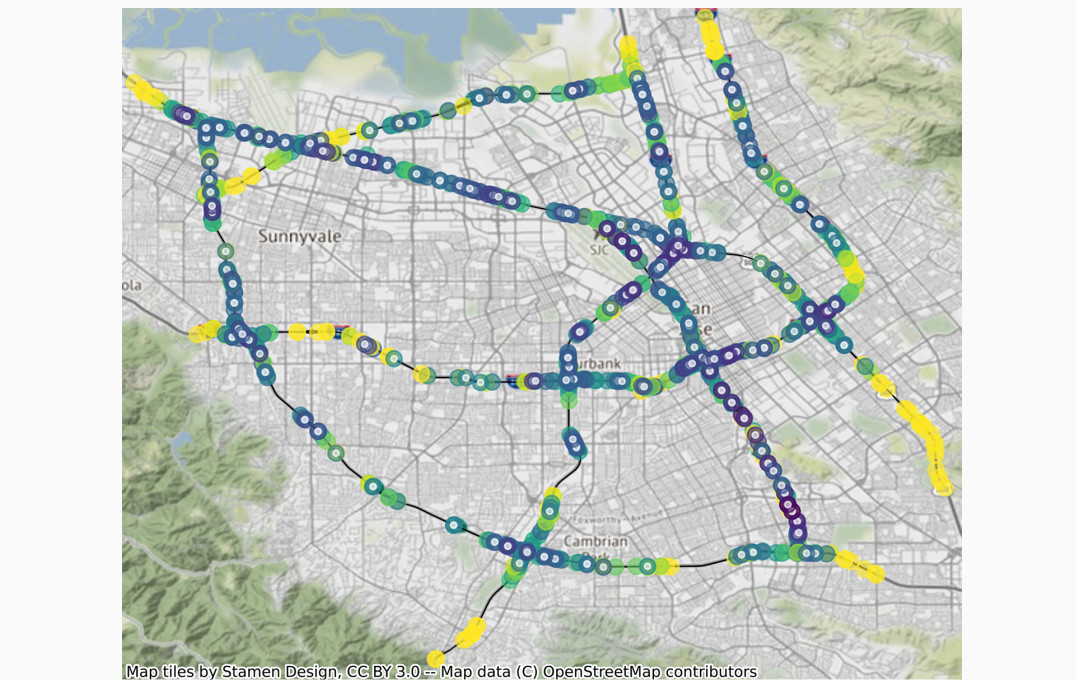
Standard deviation: global
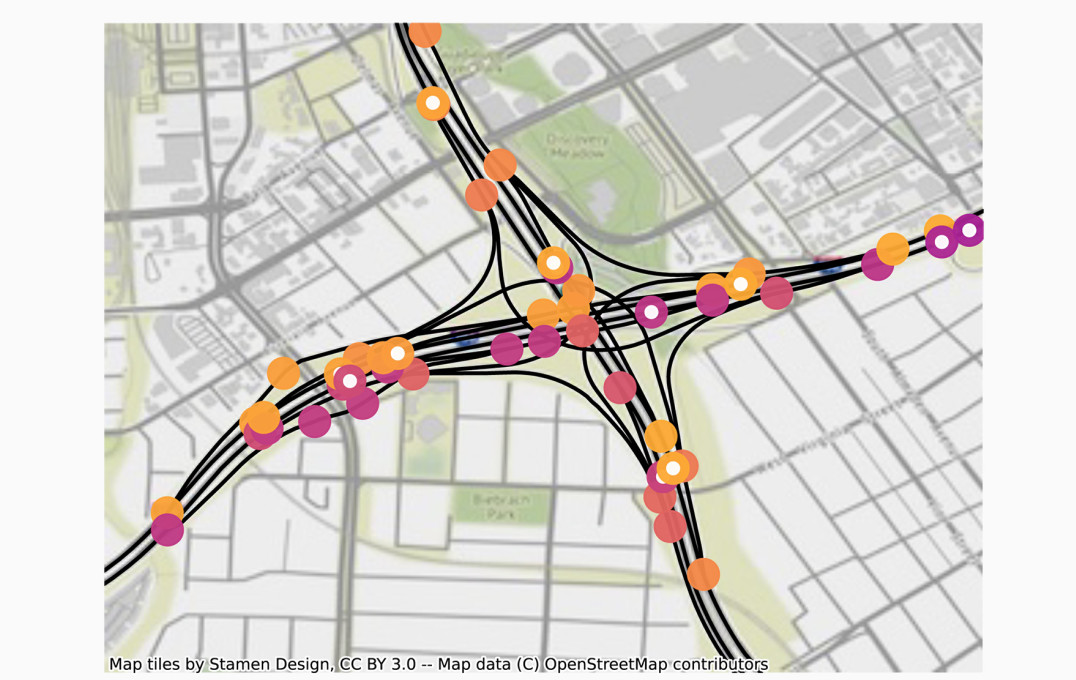
Mean: local
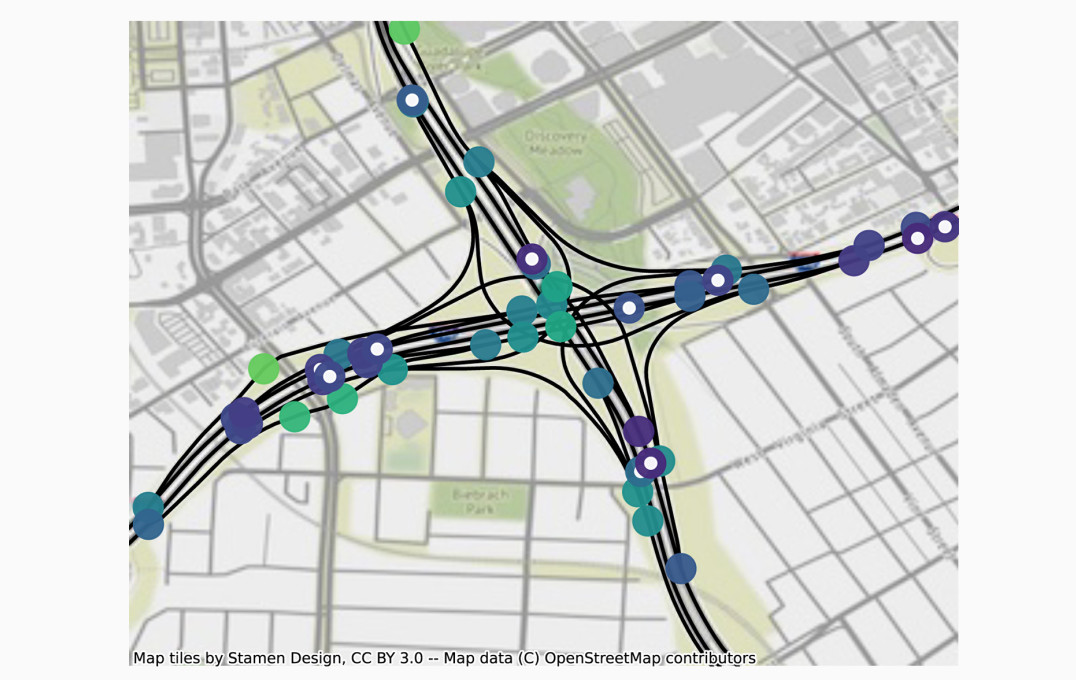
Standard deviation: local
Gaussian processes are one of the simplest ways to represent information in a way that can handle uncertainty and be used for making decisions. Given how ubiquitous such processes are, I find them a fascinating subject to study.
What are the benefits of visualising academic science like this, particularly in machine learning?
Visualisations are simultaneously a critical component of scientific inquiry, debugging, and communicating ideas about the systems we consider. Alex Terenin Research postgraduate, Department of Mathematics
Visualisation is a critical part of machine learning research because it provides a way to interact with a learning system in order to understand what it’s doing. Often, the information that one can extract and interpret is much richer than that which can be represented by simple numbers. In this way, visualisations are simultaneously a critical component of scientific inquiry, debugging, and communicating ideas about the systems we consider.
I think visualisation is an underrated aspect of work within mathematical sciences – in my experience it can make a difference between a paper getting accepted or not. People sometimes have the impulse to make their work seem complex, but I have come to believe this impulse should be resisted at every opportunity because the audience genuinely wants to understand the ideas. It’s better to write in the simplest possible manner, ideally making everything in the paper seem clear, even obvious, in spite of the complexity of a subject.
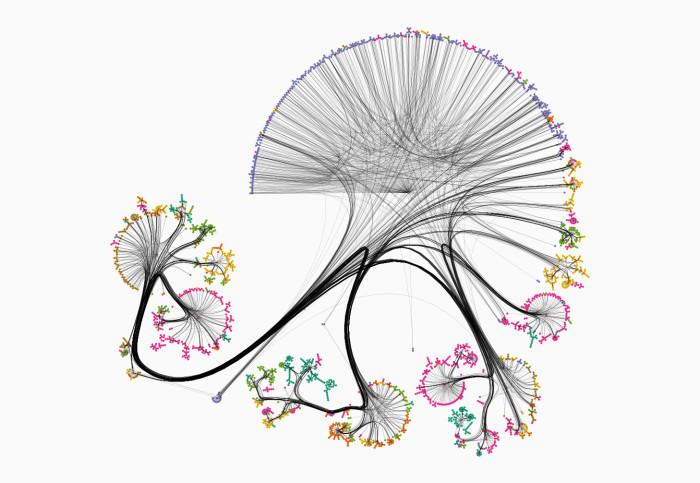
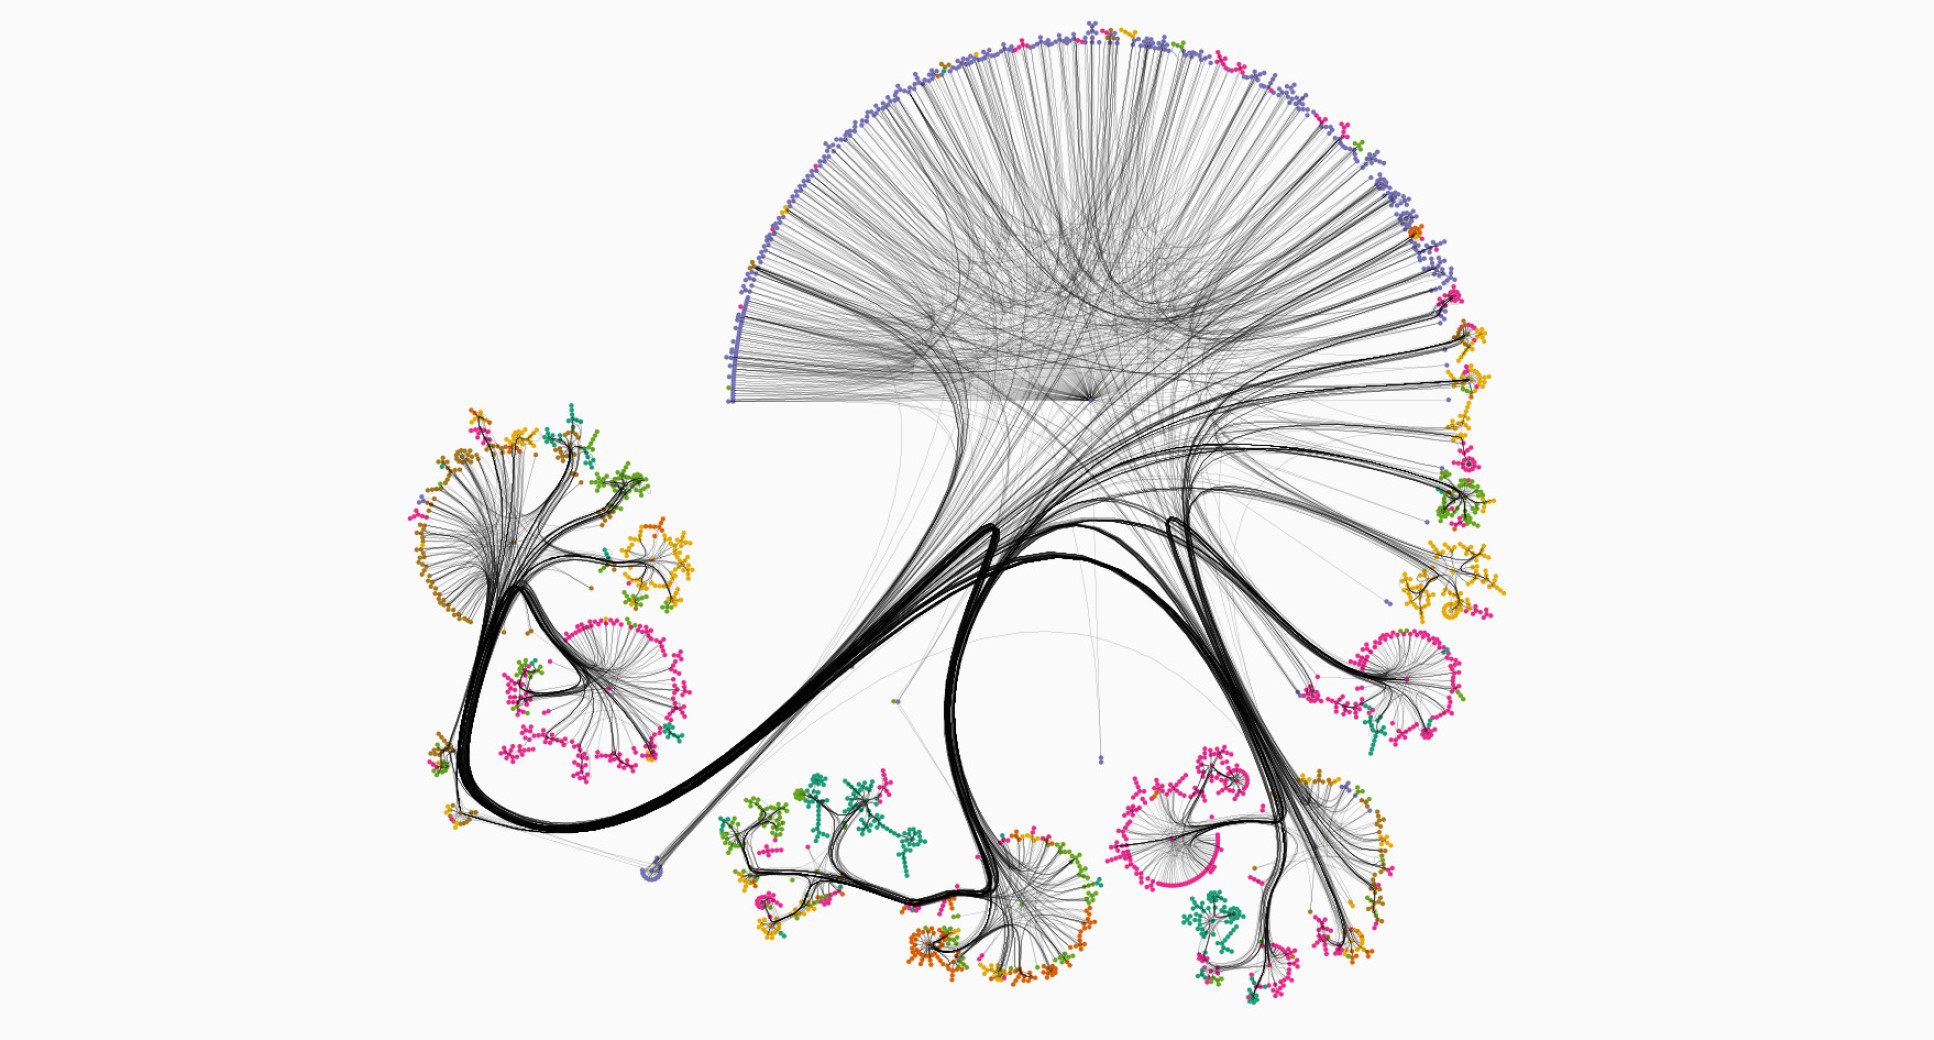
Visualisation is also satisfying because it can produce beautiful graphics. In the following image we show a simplified demonstration of a graph Gaussian process model: classifying a scientific paper’s topic based on its references. The graph here is a scientific citation network: nodes – coloured dots – represent papers, and edges – black curves – represent citations between papers. The colour of each node represents a paper’s predicted topic according to the model. Though it is not pictured, each prediction here also comes with its associated uncertainty, just like shown in the previous video.
Why do you think your paper stood out to the reviewers?
Our goal is to make these techniques and methods accessible to a much larger audience of machine learning experts who understand but are perhaps not experts in Gaussisan processes. Alex Terenin Research postgraduate, Department of Mathematics
I think our paper stood out to the reviewers because of communication and writing quality. The scientific novelty within this paper is actually much lighter than in most other works I’ve published, because the main goal of the paper is to translate certain, somewhat obscure, ideas within the statistics literature into language accessible to a wider machine learning audience, and showcase what these methods are capable of.
We do propose techniques, but these are reasonably straightforward to Gaussian process experts. Our goal is to make these techniques and methods accessible to a much larger audience of machine learning experts who understand but are perhaps not experts in Gaussisan processes. Because of this, the paper at times reads like a review or tutorial – we put quite a bit of time and effort into making the presentation clean and understandable to a general machine learning audience. We also put effort into thinking up visuals and demonstrations that are non-standard to the Gaussian process community, so as to encourage readers’ imaginations to think about what is possible.
Tell us more about the conference and your experience presenting.
One of the exciting things about machine learning conferences is that they are very general and attract papers from authors coming from many different scientific backgrounds. This brings together a lot of people who may not otherwise see each others’ work or talk to each other, so they're really a great forum for discussing ideas. It’s very exciting to see some of the very different kinds of work that are out there!
AISTATS, NeurIPS, ICML, and ICLR, and a few other closely-related conferences are the important academic events in the field of machine learning, so it was great to have the opportunity to present at AISTATS this year. I enjoy presenting, probably because I’m quite an outgoing person – I enjoy the ability to communicate scientific ideas with other interested people! I also like the process of making visuals and figuring out the right way to present material in an enlightening manner. I take presentation quality very seriously and work in a highly customised web-based presentation framework which simultaneously supports videos and animations together with high-quality mathematical typesetting – my talk is available on my website.
What are your thoughts about how conferences have had to adapt to being fully remote during the pandemic?
The conference was held entirely remotely because of the pandemic, and though it was great and really well-organised, I miss the face-to-face interactions of pre-COVID events. I feel that online a significant part of the experience is missing, particularly coffee chats in-between talks with other scientists, which can be very valuable and help one get to know the community. With a remote setup, it’s very easy for people to work on their day-to-day work instead of coming to interact with others. A benefit of the remote setup, though, is that a substantially larger amount of people can attend, and it makes events way more accessible.
Why did you choose a PhD in this area?
I’ve been interested in statistical machine learning for as long as I have known about it. I received my bachelors’ at the University of California, Santa Barbara in the USA, with a dual degree in statistical science (BSc) and psychology (BA), and between my third and fourth year, attended an undergraduate research experience at Lewis and Clark College working on Computer Go – famously solved a few years later by a team at Google DeepMind. This exposed me to scientific research and convinced me to apply for a PhD!
Unfortunately, due to a combination of rejections, lack of financial support – I declined a master's degree offer from Stanford at one point because I could not afford the fees, which are substantially higher than in the UK – and certain instances of chaos and bad luck, it took me half a decade to actually be able to fully realise that dream! With time, I eventually joined Imperial in Marc Deisenroth’s Statistical Machine Learning group, which recently moved to UCL, and things have been very successful ever since. Upon finishing my PhD, I will start as a Postdoctoral Research Associate in the Machine Learning Group within Computational and Biological Learning Lab at the University of Cambridge.
What appealed to you about studying at Imperial, and what have you learnt during your PhD experience?
I decided to do a PhD in Europe because degrees are typically three years long here, rather than a much-longer degree in the United States which would have had me finishing in my thirties. I’m now writing up my thesis and about to graduate!
I’ve learned a lot – Imperial has helped immensely with my technical development and becoming much more mathematically and theoretically fluent. I’ve also learned a lot about the scientific process, what kind of ideas are most important, and how to start and maintain scientific collaborations – all of my projects have been jointly developed with others, with everybody bringing together different skillsets. Coming here has also given me the experience of being an immigrant in a different country with its own customs and intricacies, which has been fascinating in its own right.
Thanks for taking time out from writing up your thesis to talk to us Alex!
Find out more at the following links:
- View Alex’s website to learn more about his research and follow him on Twitter
- PhD opportunities in the Departments of Mathematics and Computing
- Find out more about Imperial’s Machine Learning Initiative
Article text (excluding photos or graphics) © Imperial College London.
Photos and graphics subject to third party copyright used with permission or © Imperial College London.
Reporter
Claudia Cannon
The Grantham Institute for Climate Change