The variation of solar energy entering Earth's atmosphere, the solar irradiance (see Figure 1), is an important input in climate models. Observations of wavelength-integrated solar irradiance have been made since 1978 and spectral observations have been patchy and limited to the ultraviolet. With the launch of missions such as SORCE and SCIAMACHY, data covering wavelengths that have no continuous observations, the visible and infrared, is beginning to accumulate. We are using the SATIRE model (detailed below) to compare our predictions with the observations.
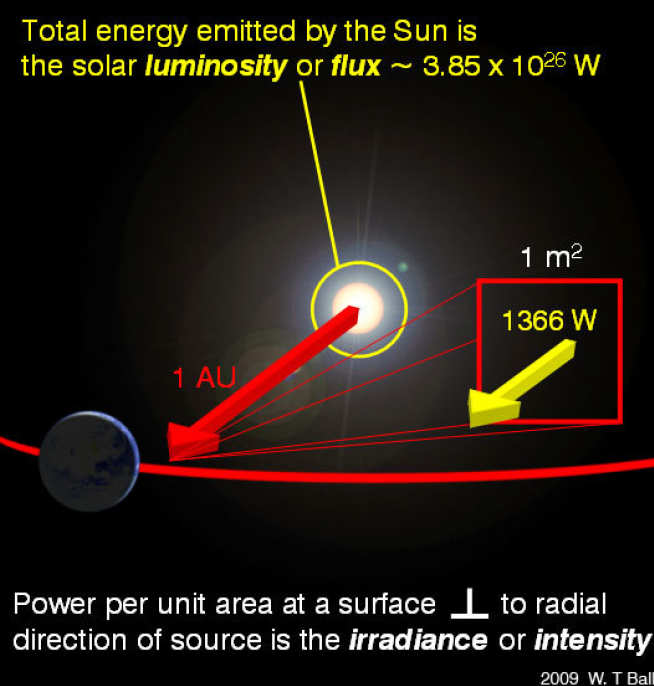
Fig. 1: The luminosity of the Sun is the radiative energy, or flux, emitted over the entire surface. Irradiance, or intensity, in the context of solar irradiance discussion is defined as the flux passing through a surface area of 1 m^2 perpendicular to the direction of the Sun at a distance of 1 AU.
The total solar irradiance (TSI) is measured to be approximately 1366 Wm^-2. The spectral solar irradiance (SSI) is the incident radiation observed with a particular wavelength, measured in units of Wm^-3 or Wm^-2nm^-1.
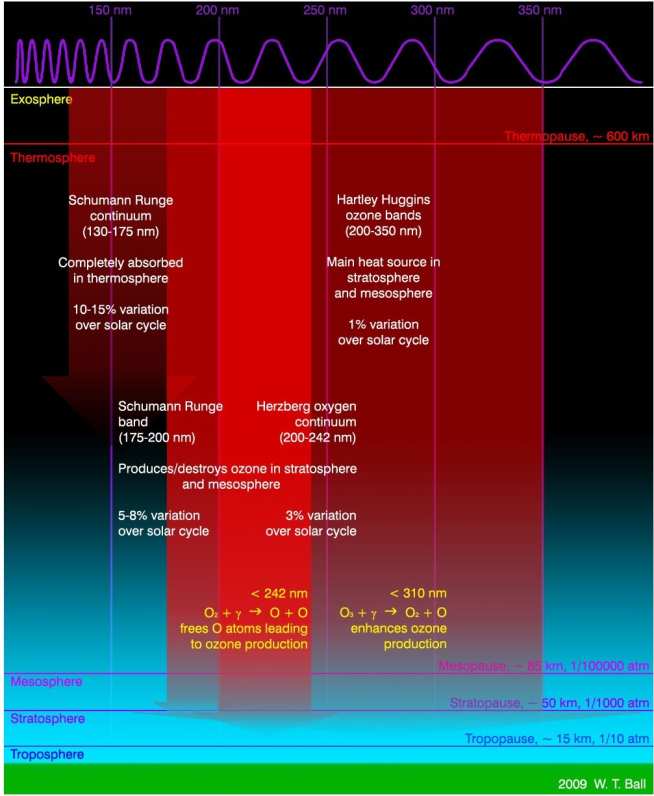
The SSI is important because different parts of the solar spectrum affect different regions of Earth's atmosphere (see Figure 2). Most of the solar energy is emitted in the visible (40% of TSI emanates in the 400-700 nm region), but because parts of the solar spectrum are produced from different regions in the solar atmosphere they can vary independently of each other. As a result the ultraviolet (below 400 nm) contributes ~60% of the total variability in TSI.
Fig. 2: Solar forcing on Earth's atmosphere is wavelength dependent. The UV is the most continually observed spectral region and it is known that different wavelengths heat various parts of the atmosphere and are involved in many chemical processes including ozone modulation.
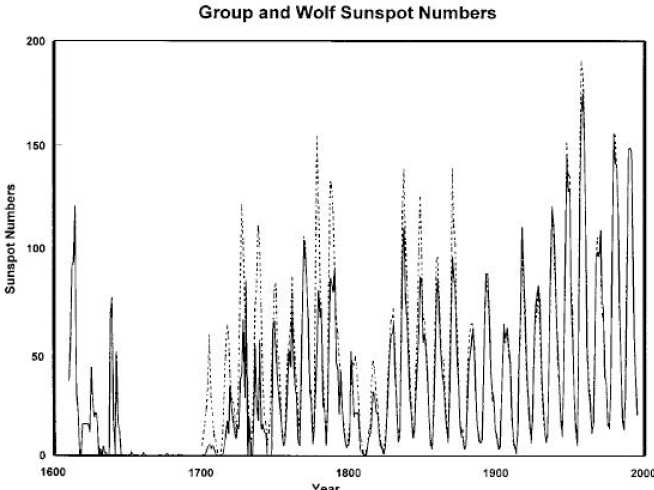
The sunspot number, with observations dating back to the 17th century, were the first indication that the Sun varies over time (see Figure 3) and a clear 11-year cycle emerged. It was not until the dawn of the satellite era that direct evidence of irradiance variation was found.
Fig. 3: Sunspot Group (solid line) and Zurich (dashed) number since 1610 from Hoyt & Schatten, 1998. The 11-year cycle is clear here, but superimposed on a long-term trend since the Maunder Minimum of 1645 - 1715.
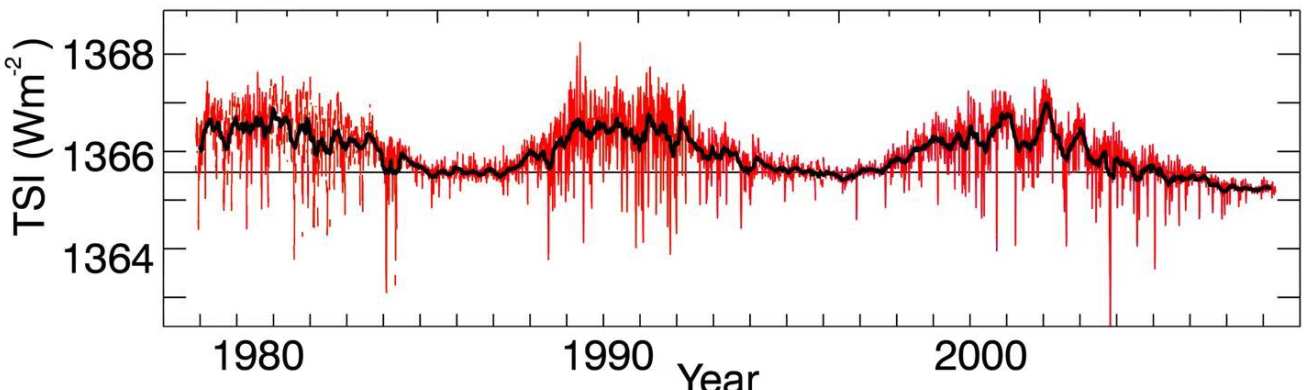
There are now nearly three 11-year solar cycles of data and observations from several different satellites have been composited to produce a continuous data set of TSI ranging from 1978 to the present data. There are differences between composites and this highlights an inherent uncertainty and the possibility that changes between minima may be possible. However, what is clear from all composites is that during maxima both overall TSI and variability is higher, due to facular coverage and spot transits respectively. Very large sunspot groups cause short decreases in TSI of over 0.2% but the impact of facular and network regions for periods longer than weeks compensates this and TSI increases by 0.1% between minima and maxima (see Figure 4).
Fig. 4: The PMOD composite (adapted from Frohlich, 2009). Short sharp drops in the daily data (red) are the result of sunspot passages. The running mean (black line) shows a clear increase of 0.1% over an 11-year cycle.
The creation of a long-term UV data set is also difficult. Absolute irradiance offset and degradation corrections remain an issue, but each instrument also has a different resolution: if rapidly varying features are not sufficiently resolved they may not be present in some data sets and determining variation is more difficult. Nevertheless, observations of the UV over the past three decades has revealed complex spectral behaviour and wavelength dependent contribution to TSI change. As with TSI, variability and irradiance increases at solar maximum above atmosphere observations have revealed that the 200-300 nm region varies on the order of a few percent, 150-200 nm by 10-20% and shorter regions by over 50%. However, contribution to TSI is tiny in this region: most radiative energy comes from the visible and near-IR and prior to the SORCE mission was a region not well observed.
The Sun is also thought to vary on even longer timescales and, as can be seen in figure 3, activity variation is not limited to the 11-year cycle: there appears to be secular trend of increasing solar activity since the beginnning of the 18th century after a period of almost no sunspots. Understanding the causes of this century-scale variation is a major goal of solar irradiance studies. If the long-term impact of the Sun on Earth's climate is to be fully understood, then correct modelling of variation by wavelength is required (find out more about contribution of small scale magnetic elements here). While the solar cycle variability likely impacts on terrestrial temperatures, both in height and location, it is not fully understood which spectral regions cause such a change.
Text by Will T. Ball, extract from thesis in work.