Water-to-cement (w/c) mass ratio is important because it controls the mechanical properties and durability of hardened concrete. When problems occur and/or non-compliance with the specification is suspected, it is often desirable to be able to determine the w/c ratio. There are two existing methods to estimate the w/c ratio, the physico-chemical method described in BS1881:124:1988 and the fluorescence microscopy method described in Nordisk NT361-1999.
The physico-chemical method is known to have low precision, estimated to be within 0.1 (w/c ratio) or greater1, 2, and thus has little practical value. The fluorescence method relies on the use of reference standards for comparison and calibration, which must be made with the same cement and aggregate type, air content and hydration degree, in addition to w/c ratio, as the concrete being examined1, 2. The aim of this study is to develop a new microscopy-based method to estimate the original w/c ratio that overcomes the disadvantages of existing techniques.
Method
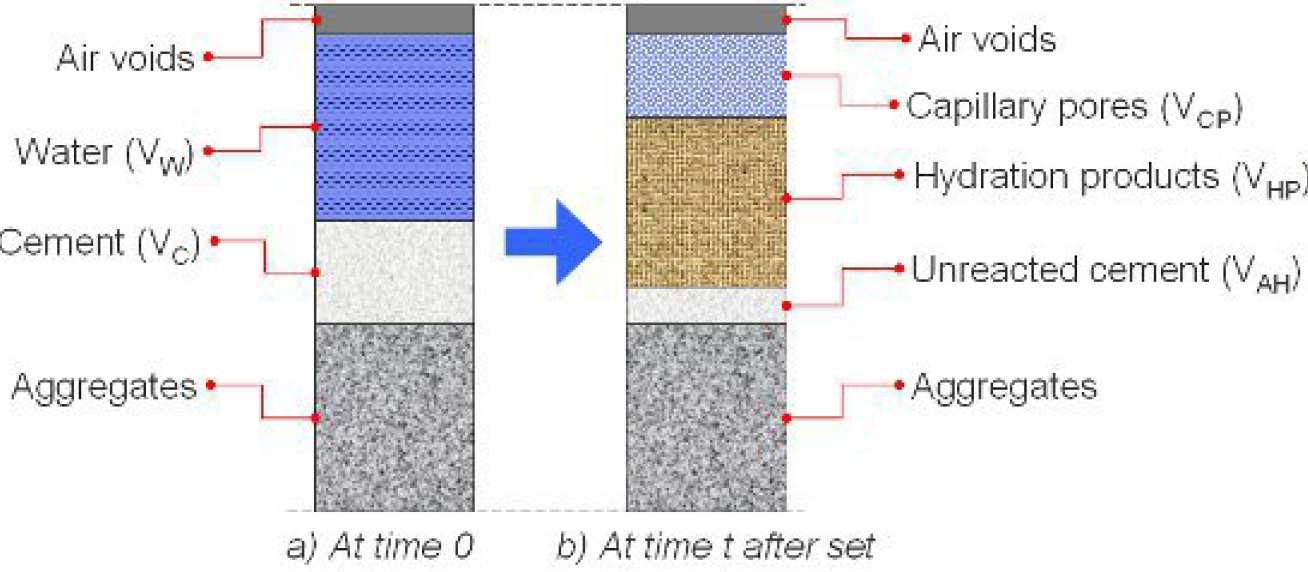
Considering that the volume fractions of aggregates and air voids are invariant with time, and the total shrinkage is small and negligible, we can write the following equation from Fig. 1:
VC + VW = VAH + VHP + VCP
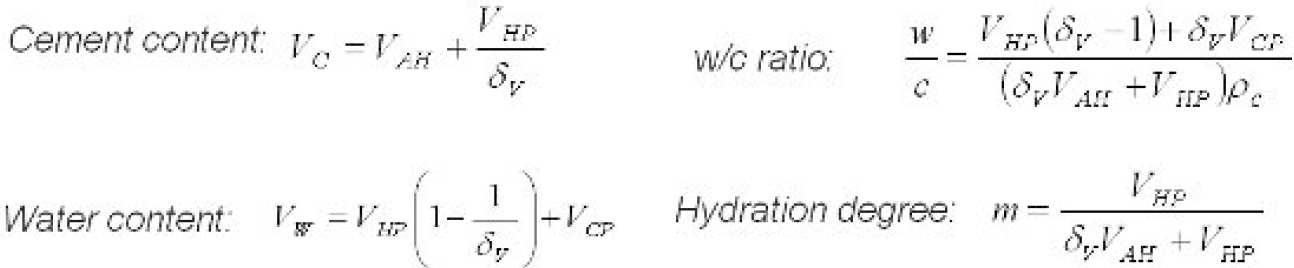
VAH, VHP and VCP can be measured with backscattered electron microscopy (Fig. 2) and the results are then used to calculate the cement and water content, w/c ratio and degree of hydration:
Where ρC is the specific gravity of cement and δV is the volumetric increase of solids during hydration, which is approximately equal to two. The value of dV can also be calculated from the cement composition3.
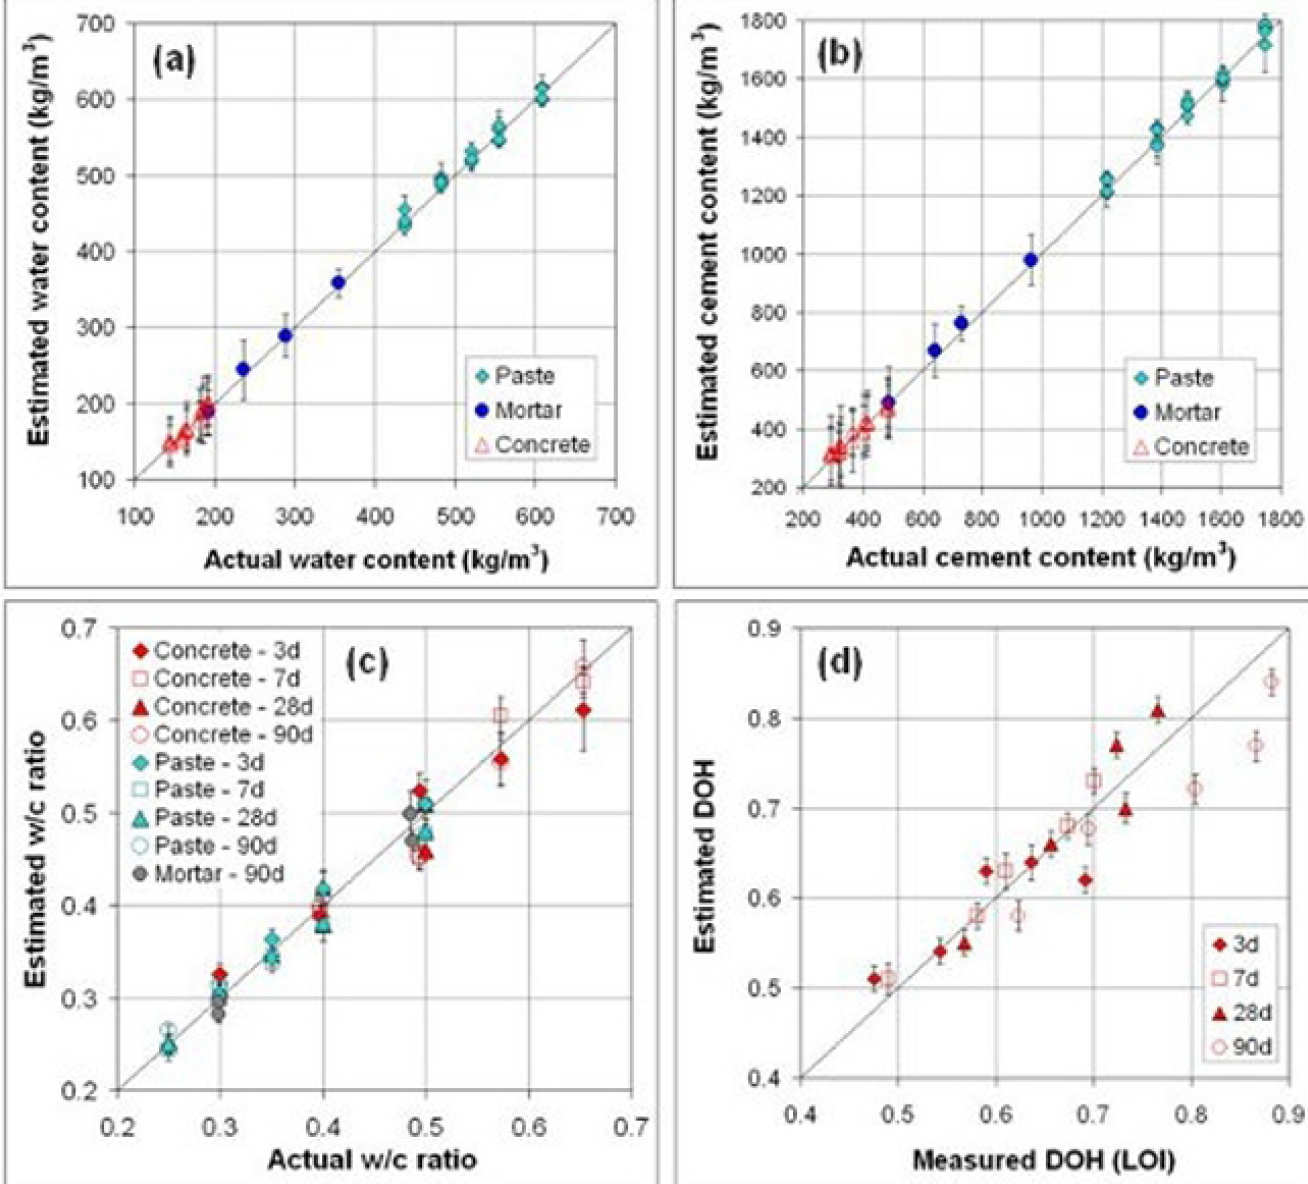
Results
We have tested the method on a wide range of concretes, mortars and pastes4, 5, 6. The mix variables include w/c ratio (0.25-0.70), cement content (300-1750kg/m3), aggregate content (40-70% vol.) and curing age (3-90 days).
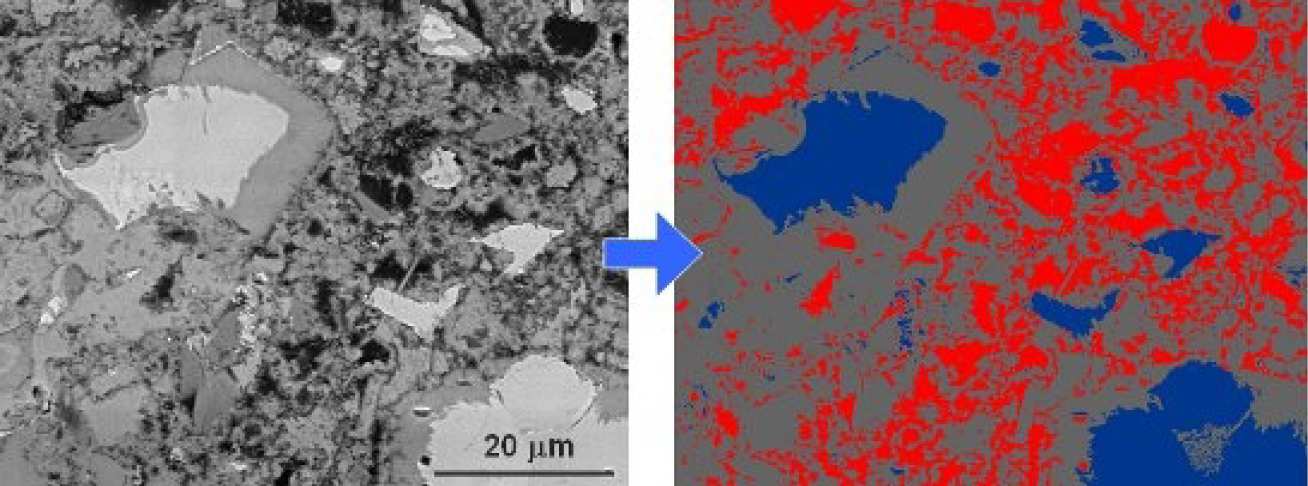
Fig. 3a shows the variation in the estimated w/c ratio for each image for the 0.4 w/c ratio mixes. It can be seen that the spread in local w/c ratio is higher in concretes compared to pastes. This is due to bleeding effects and presence of aggregates that increases the heterogeneity of the concrete microstructure. However, the results tend to converge when a representative number of images are analysed and averaged (Fig. 3b).
Fig. 4 compares estimated values against the actual values for all samples. The error bars indicate 95% confidence interval. The results show a good agreement between the measured and actual values. The percentage estimation errors for cement content, water content, w/c ratio and degree of hydration ranged from -3.2 to 10.2%, -2.3 to 5.8%, -8.6 to 8.4% and -11.3 to +7.2% respectively. The errors do not appear to be influenced by either the mix proportion or curing age.
Conclusions
A new method that determines the cement content, water content, w/c ratio and degree of hydration of hardened Portland cement concrete with unknown mix proportion is presented. The method is based on measuring the volume fractions of unreacted cement, hydration products and capillary pores in the concrete using backscattered electron microscopy.
The method has the advantage that it is objective, reproducible and does not require comparison to reference standards or calibration curves. The method has been tested on pastes, mortars and concretes having a wide range mix proportions and age with encouraging results. The error in estimating the free w/c ratio was found to be less than 0.025 for pastes, and less than 0.05 for mortars and concretes.
References:
- A.M. Neville (2003), How closely can we determine the water-cement ratio of hardened concrete, Mat. Struct., 36, 311-318.
- D.A. St John, A.W. Poole, I. Sims (1998), Concrete Petrography, John Wiley & Sons, 474pp.
- T.C. Powers, T.L. Brownyard (1946-47), Studies of the physical properties of hardened Portland cement paste, J. Am. Concr. Inst., 43 (9 parts), 101-132, 249-336, 469-504, 549-602, 669-712, 845-880, 933-992.
- H.S. Wong, N.R. Buenfeld (2009), Determining the water-cement ratio, cement content, water content and degree of hydration of hardened cement paste: Method development and validation on paste samples, Cem. Concr. Res., 39, 957-965.
- H.S. Wong, K.R. Matter, N.R. Buenfeld (2009), Estimating the water/cement (w/c) ratio of hardened mortar and concrete using backscattered electron microscopy, 12th Euroseminar on Microscopy Applied to Building Materials, Dortmund, 96-97.
- H.S. Wong, K. Matter, N.R. Buenfeld (2013), Estimating the original cement content and water-cement ratio (w/c) of Portland cement concrete and mortar using backscattered electron microscopy, Mag. Concr. Res., 65 (11) 693-706.
- M.H.N. Yio, J.C. Phelan, H.S. Wong, N.R. Buenfeld (2014), Determining the slag fraction, water/binder ratio and degree of hydration in hardened cement pastes, Cem. Concr. Res., 56, 171-181
- H.S. Wong, N.R. Buenfeld (2007), Estimating the water/cement (w/c) ratio from the phase composition of hardened cement paste, 11th Euroseminar on Microscopy Applied to Building Materials, June 5-9, Universidade do Porto, Portugal, 113-114
Contact us
Prof Nick Buenfeld
Tel: +44 (0)20 7594 5955
E-Mail: n.buenfeld@imperial.ac.uk