TAFTS makes a true differential measurement of two input signals.
Laboratory Spectra
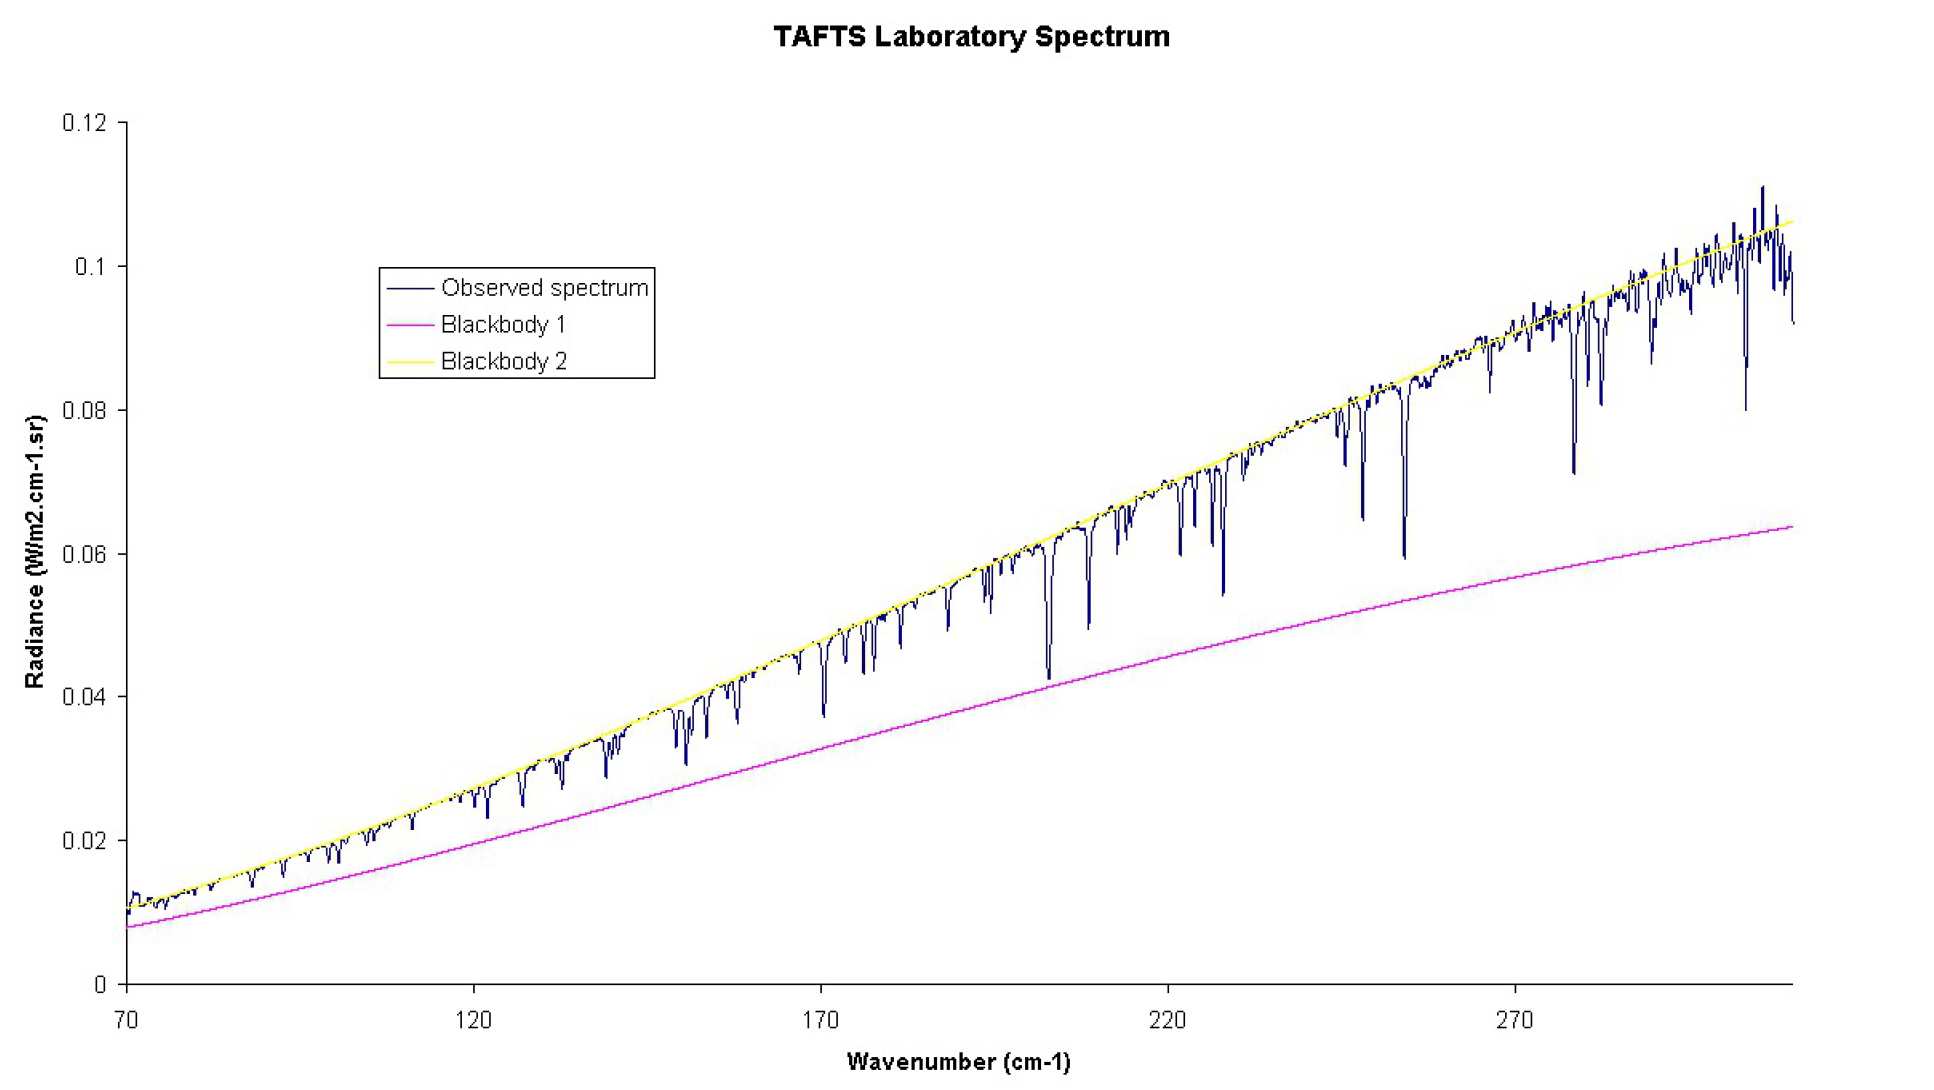 Figure 1. TAFTS laboratory spectrum: longwave channel. In this case input 1 was a blackbody at 295 K and input 2 a blackbody at 232 K. A blackbody radiance spectrum at 232 K has been added to the differential spectrum and this is shown above. The absorption features are due to residual water vapour. The spectrum is a coaddition of 4 scans, 2 seconds/scan.
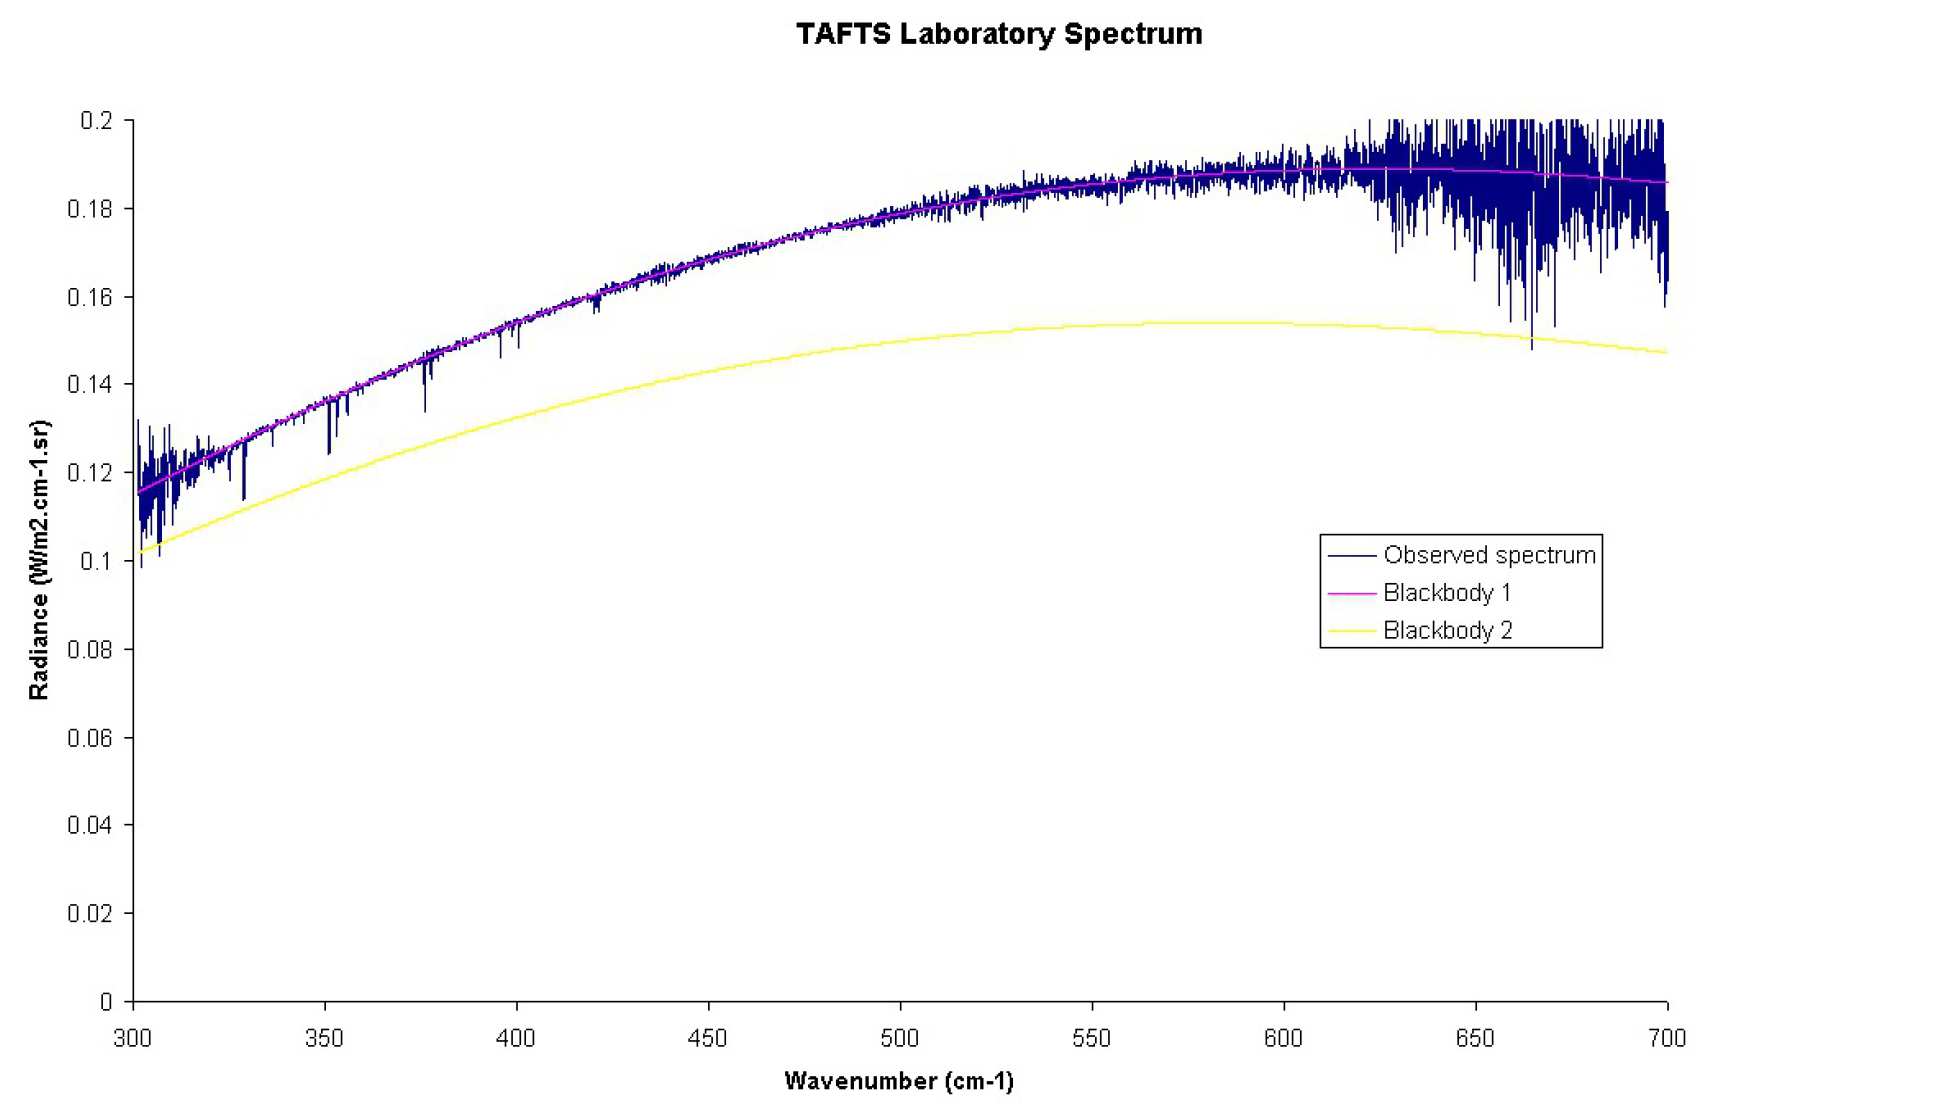
Figure 2. TAFTS laboratory spectrum: shortwave channel. In this case input 1 was a blackbody at 316 K and input 2 a blackbody at 296 K. A blackbody radiance spectrum at 296 K has been added to the differential spectrum and this is shown above. The absorption features are due to residual water vapour and carbon dioxide.Single 2 seconds.
Airborne Spectra
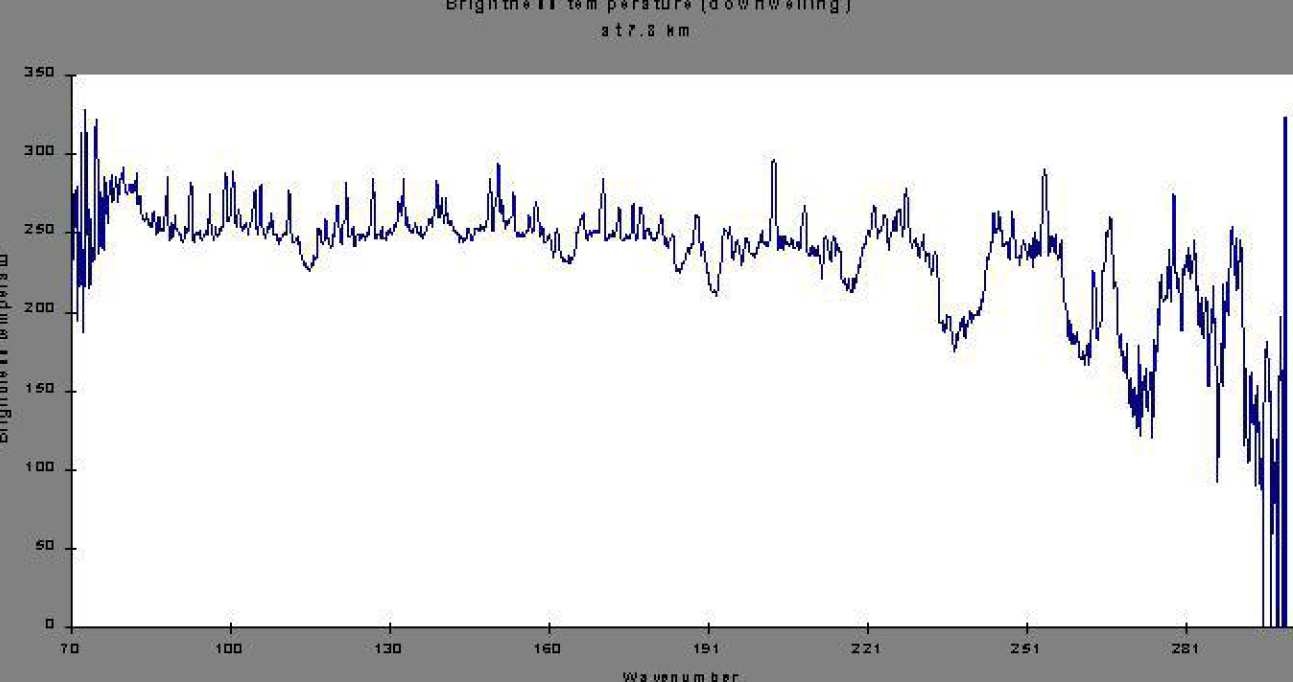
Figure 3. Spectrum taken using TAFTS on an engineering flight in September 1999. The spectrum is of down-welling radiation, converted to brightness temperature, at about 27,000. The data shown was acquired in a 2 second scan from one of the two longwave channels. Very strong water lines can be clearly seen as high temperature peaks and are due to water vapour in the warmer environment of the pointing head, the lines are seen to saturate at a temperature of about 280 K.
More airborne spectra to come!