Reconstruction of total and spectral solar irradiance is performed using the Spectral And Total Irradiance REconstruction model (SATIRE, see Figure 1 for a description). We are currently using SOHO Michelson Doppler Imager (MDI) continuum intensity images and magnetograms to identify the various surface magnetic features to solar irradiance changes: the main assumption is that the evolution and distribution of magnetic features on the solar surface are the underlying cause of irradiance variation.
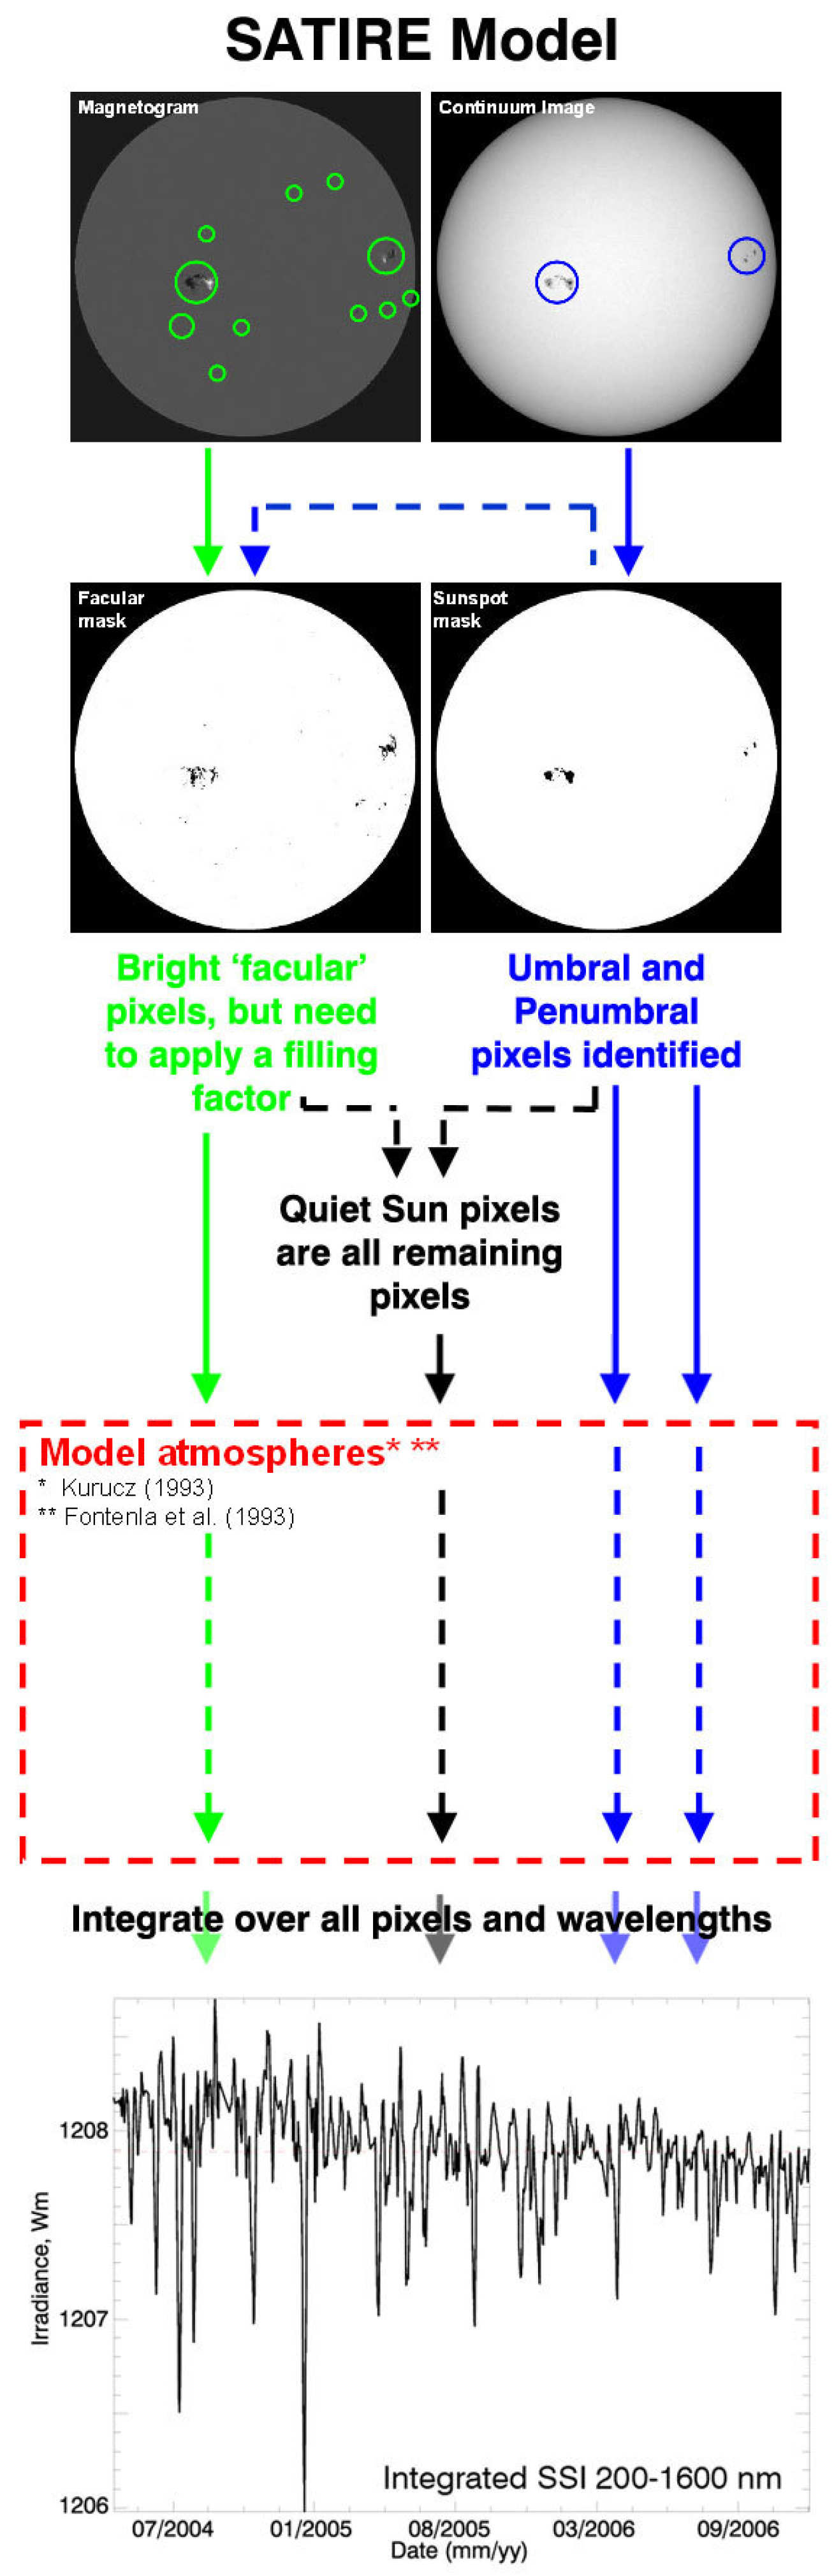
Fig. 1: The SATIRE model takes SOHO MDI magentogram and continuum images to identify magnetic and dark pixels. This then allows umbral, penumbral and facular pixels to be identified, while quiet sun pixels are those remaining. Faculae are unresolved in conitnuum images, so a pixel filling factor that determines the facular contribution within that pixel is calculated based on the magnetic field strength. The four types of pixel are then known (the masks here are a visual example of the product, we don't actually produce these) and then model atmospheres are applied to each of them depending on their position on the disk. Finally all pixels are integrated over a desired wavelength band for each time step. The result is a time series of irradiance variation for a given portion of the solar spectrum.
Model atmospheres (Kurucz (1993) and Fontenla et al. (1993)) are applied to these pixels to produce a time series of irradiance values. By choosing the wavelength band of preference, the contribution and variation at that wavelength can be investigated.
TSI reconstructions perform very well, showing good agreement with composite data covering the satellite era. The UV spectral region also provides a good approximation above 220 nm, except for some individual spectral lines it cannot reproduce well.
Prior to the launch of SCIAMACHY (2002) and SORCE (2003), there had been no continuous monitoring of the visible and infrared region of the solar spectrum. Thus, it was not known how they varied over the solar cycle, except through unverified models. We are currently in the process of comparing the first years of SORCE data with the SATIRE model and attempting to understand how the Sun varies by wavelength and where and how our model does not agree with the observations. We are already seeing some interesting and unexpected results and we are in the process of extending our model data set to compare as long a period as we can. We will be publishing our comparisons soon.
Text by W. T. Ball