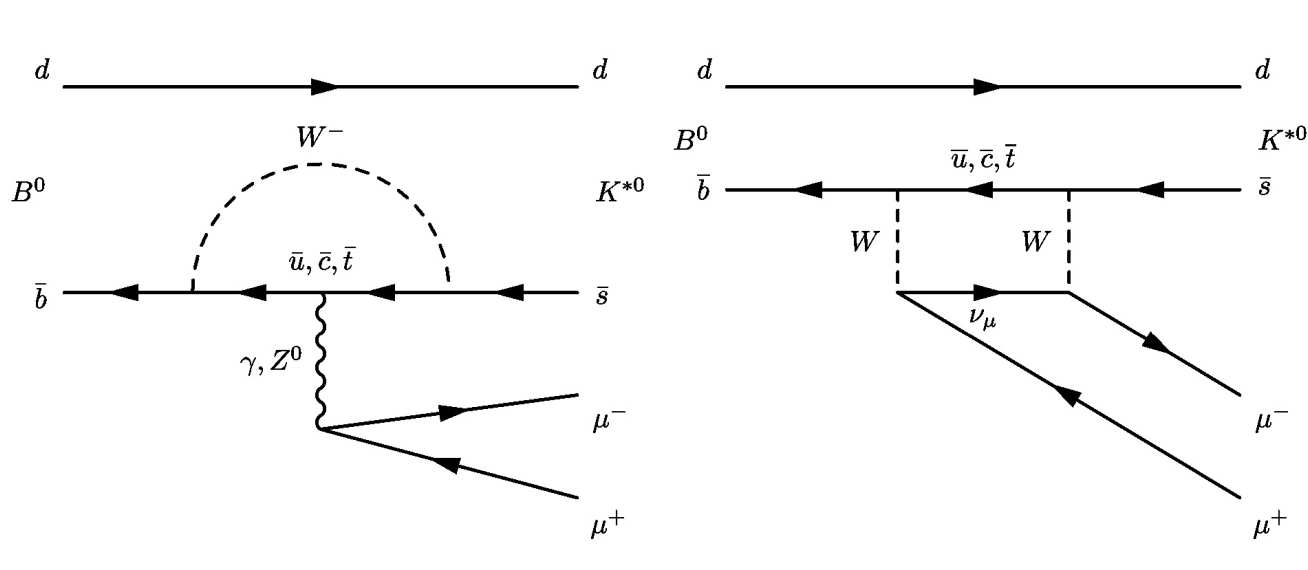
Rare decays are a special class of flavour decays, where the Standard Model (SM) prediction is very small, and so New Physics effects can have a very large contribution. They are decays of the form b → s(d)ℓ+ℓ-, a beauty quark decaying to a strange or down quark and two leptons, and are mediated by penguin and box diagrams in the SM as shown here. Imperial are involved in the analysis of a number of rare decays.
b → sℓℓ decays
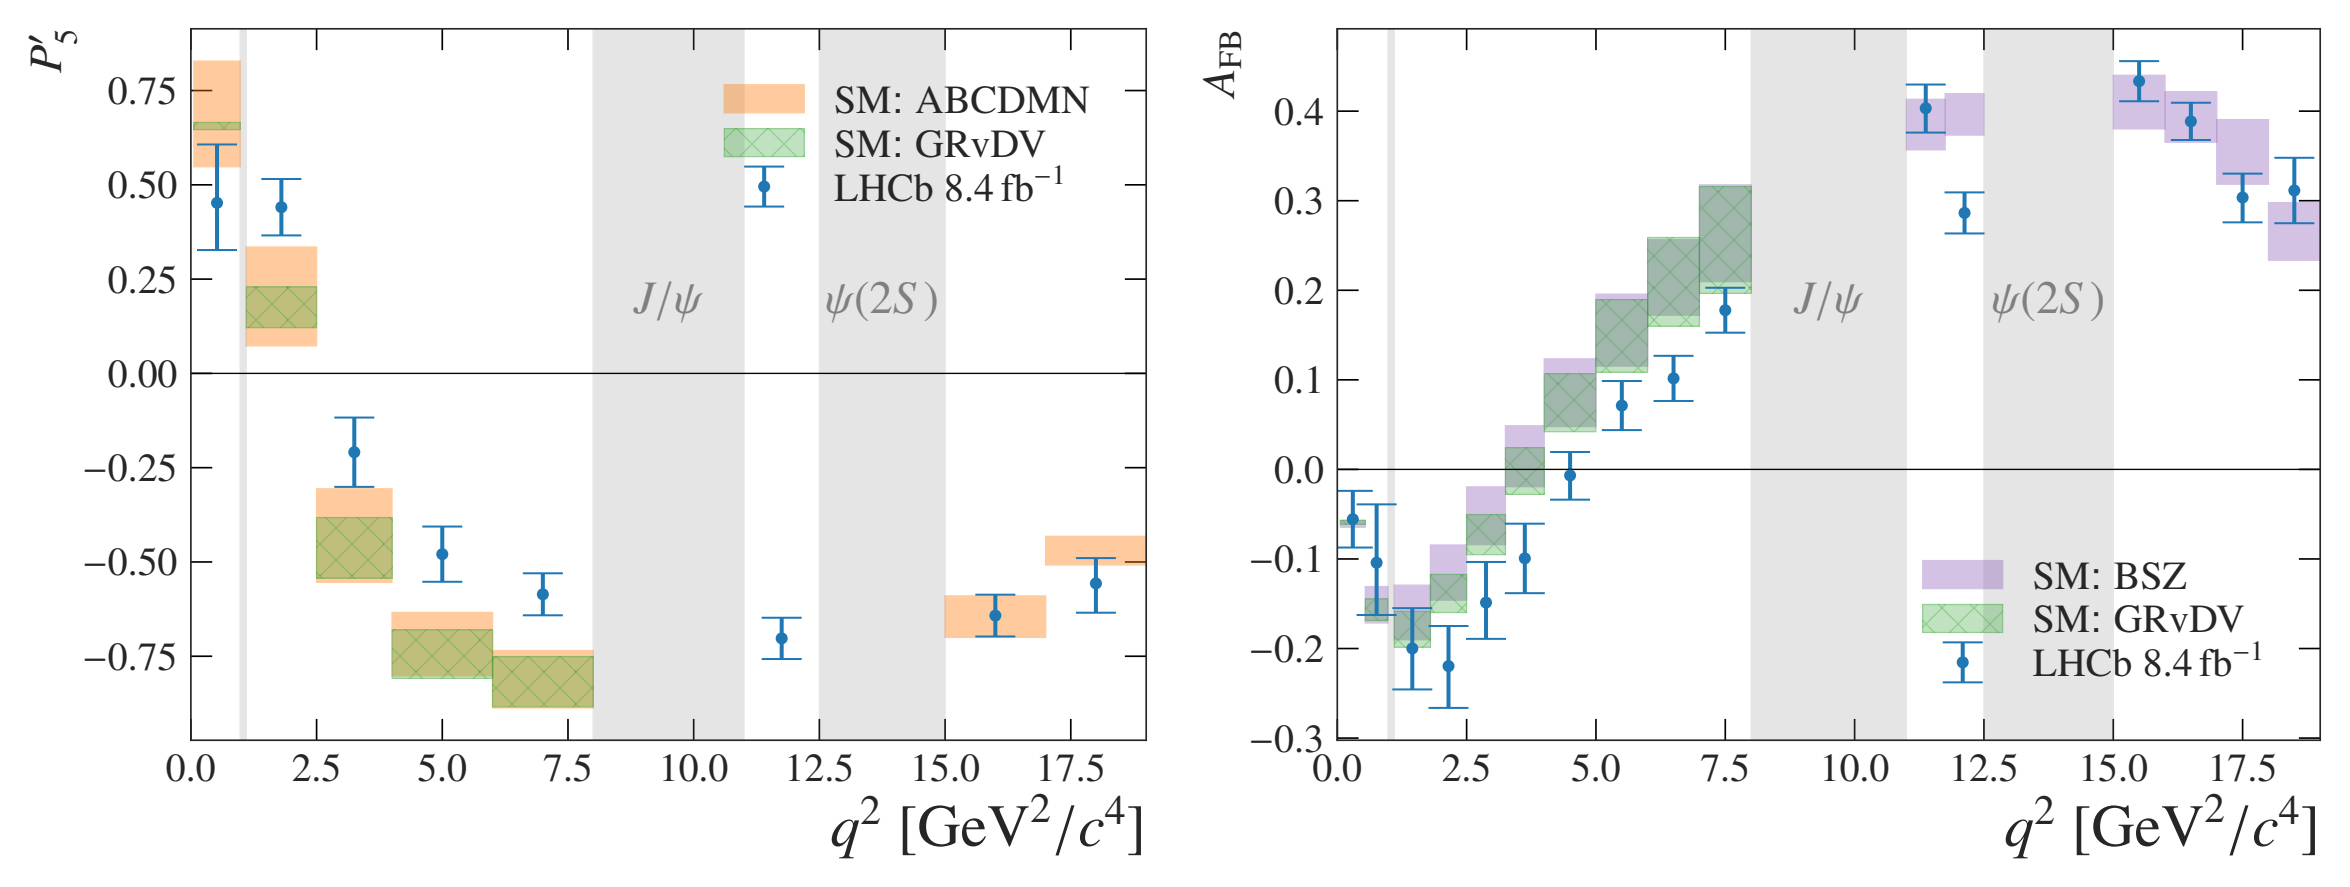
LHCb Imperial have measured the angular distributions of the decay B0 → K*0μ+μ−, which shows discrepancies with respect to the SM. The plot below presents an angular observable, P5' and AFB , as a function of dimuon invariant mass squared, q2. Several bins show deviations with respect to the SM predictions. This measurement was made with the full LHCb Run 1+2 data set and achieved unprecedented precision. The combination of all the observed quantities of this measurement shows a deviation from the SM expectations of approximately 4 standard deviations.
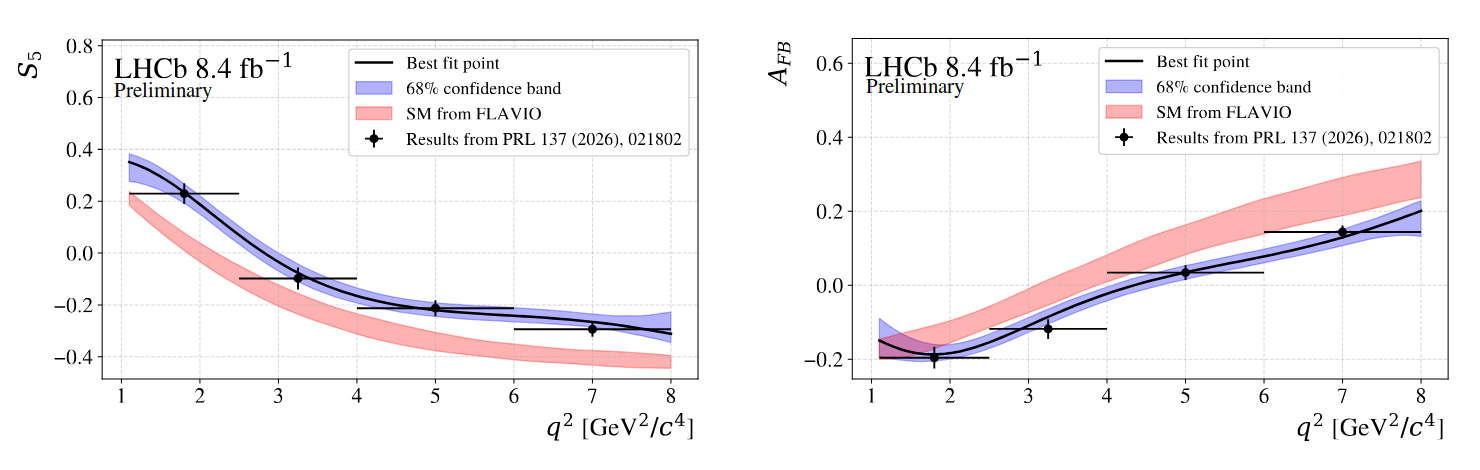
Imperial have carried out analyses of this decay process which are unbinned in q2. This allows us to measure the shape of the angular observables as a function of q2, enabling us to constrain New Physics models with better precision. For example, a major limitation of the measurement of B0 → K*0μ+μ− decays is the theoretical uncertainty caused by the interference processes proceeding via the decay b → cc̅s, known as the charm contributions (such as B0 → K*0J/ψ). We then parameterise both the charm contributions and potential New Physics contributions in our fits to the data. Similar results are obtained for the P5' observable compared to previous LHCb analyses, as seen in the plot below, disfavouring a charm-contribution-only explanation for these deviations.

Imperial have performed another analysis unbinned in q2, which aims to be as model independent as possible by parameterising the decay amplitudes as polynomials in q2. This allows theorists to compare the measurements and predictions in arbitrarily fine regions. This both improves the precision and allows the shapes of the different contributions to be disentangled. Similar results are obtained for this, as seen in the plot below.
The LHCb collaboration has recently published a result that shows that the ratio of the branching fractions for B+ → K+μ+μ− to B+ → K+e+e−, called RK, is consistent with the expectation from lepton universality in the central and low q2 regions. This suggests that any new physics effect, if present, affects muons and electrons in the same manner. Imperial recently performed this analysis in the high q2 region, again finding that the data is consistent with lepton universality.
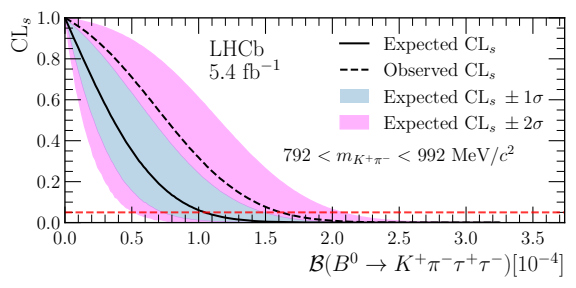
Assuming that anomalies observed in b → sμμ and b → cℓν decays (i.e the R[D(*)] ratios, which can be seen on our Semileptonic physics page) are due to New Physics, several theoretical models suggest large enhancements to the branching fractions of b → sττ decays can be expected. These decays are harder to reconstruct. Nevertheless, the LHCb Imperial group has recently published the world's best searches for search decays, one of which is shown below, improving on the world's best by an order of magnitude. Updates to this analysis are already underway, which will exploit the full power of the new data from the LHC.
b → dℓℓ decays
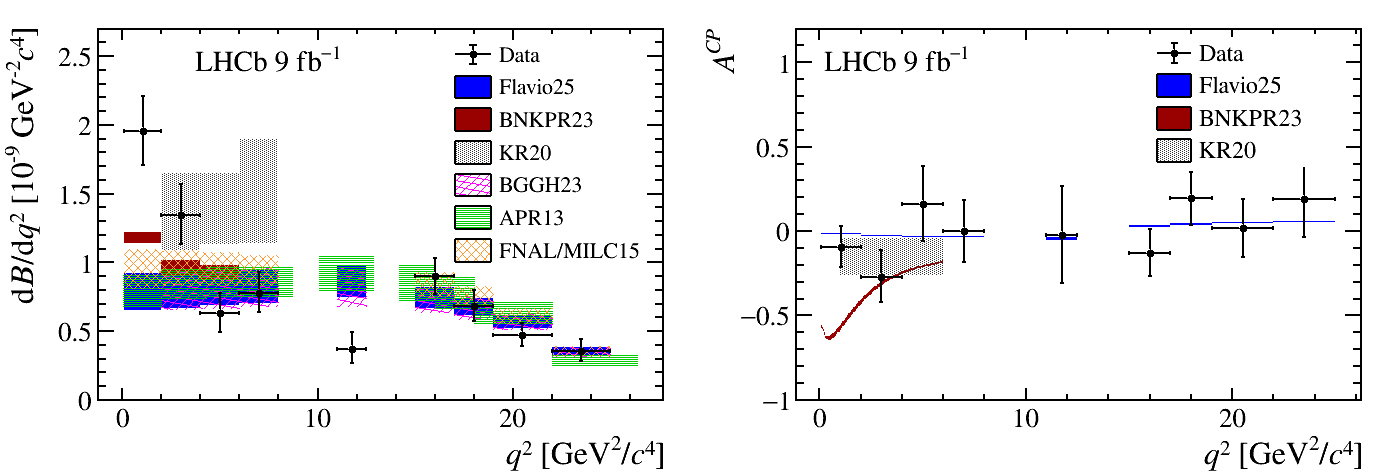
In the SM, rare decays to strange quarks are more abundant (by a factor of 25) than decays to down quarks due to the structure of the CKM matrix that describes couplings between quark generations. However, there is no requirement for New Physics to obey the same structure, meaning new particles can have an even larger relative effect in decays to down quarks. At Imperial, we have measured the branching fraction and CP asymmetry of B+ → π+μ+μ− in bins of q2. This can be seen in the figure below, where the black points are the measurement, and the coloured boxes are SM predictions with different assumptions for the influence of b → uu̅d contributions and other theoretical parameters. We can also use this measurement with the measurement of the decay to strange quarks to probe the values of the CKM matrix in loop decays.
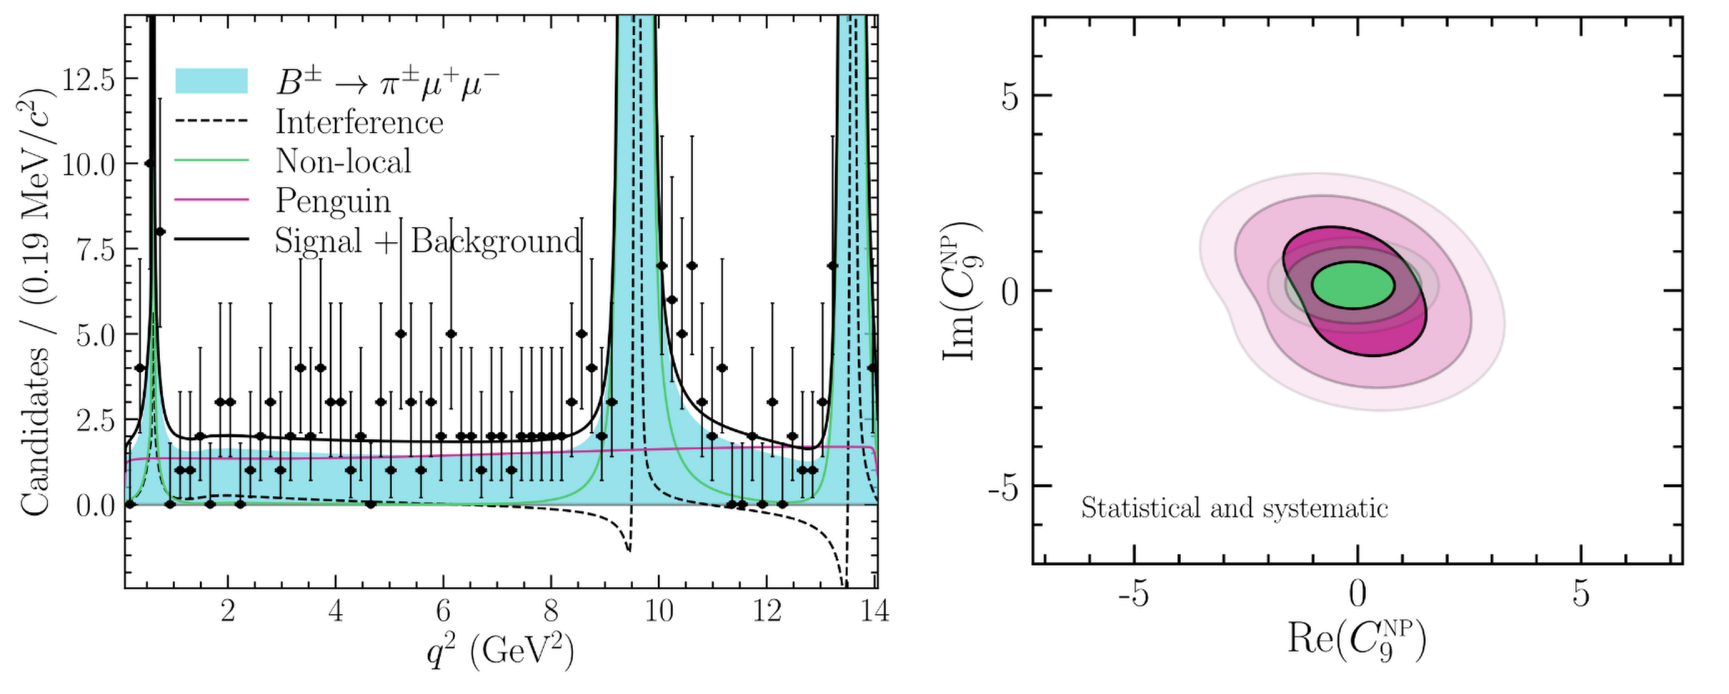
As well as the branching fraction measurement in bins of dimuon invariant mass squared q2, a similar unbinned method is also being applied to the B+ → π+μ+μ− decay. This method aims to measure directly the theoretical parameters related to the decay rate by fitting the data as a function of q2. The left figure below shows a fit to a pseudo-dataset. The decay signal is divided into three components: rare decay (solid blue), non-local resonant, and interference terms. The primary goal of this analysis is to determine the rate of the rare decay, which is described by the theoretical parameter C9 that quantifies contributions from vector currents. The likelihood profile of the real and imaginary components of C9 is shown in the right figure below, for future measurements. With this likelihood profile measured, pseudo-data can be generated for further studies of different theoretical models.