Project Background:
The Rapid Inquiry Facility (RIF) is an application that supports two types of environmental health activities: disease mapping studies and risk analysis studies. It was designed to help epidemiologists and public health researchers to rapidly investigate potential environmental hazards, especially those related to industrial sites. The tool uses health, environmental, socio-economic, population and geographic data to calculate risks in relation to sources of exposure and to generate maps.
Study Aims:
Disease mapping studies are used to visualise mortality or morbidity rates and risks across an area. They are used to explore spatial patterns of health outcomes; identify potential issues regarding data quality by geographical area; and identify areas which need additional study.
Risk analysis studies are used to provide an initial investigation into whether a suspected source of some particular exposure is having an impact on health in a local population. The tool can generate standardised rates and relative risks for a set of health outcomes. The RIF allows for full flexibility in the selection of a range of ages; a time frame specifying an era for data set collections; and a geographic area.
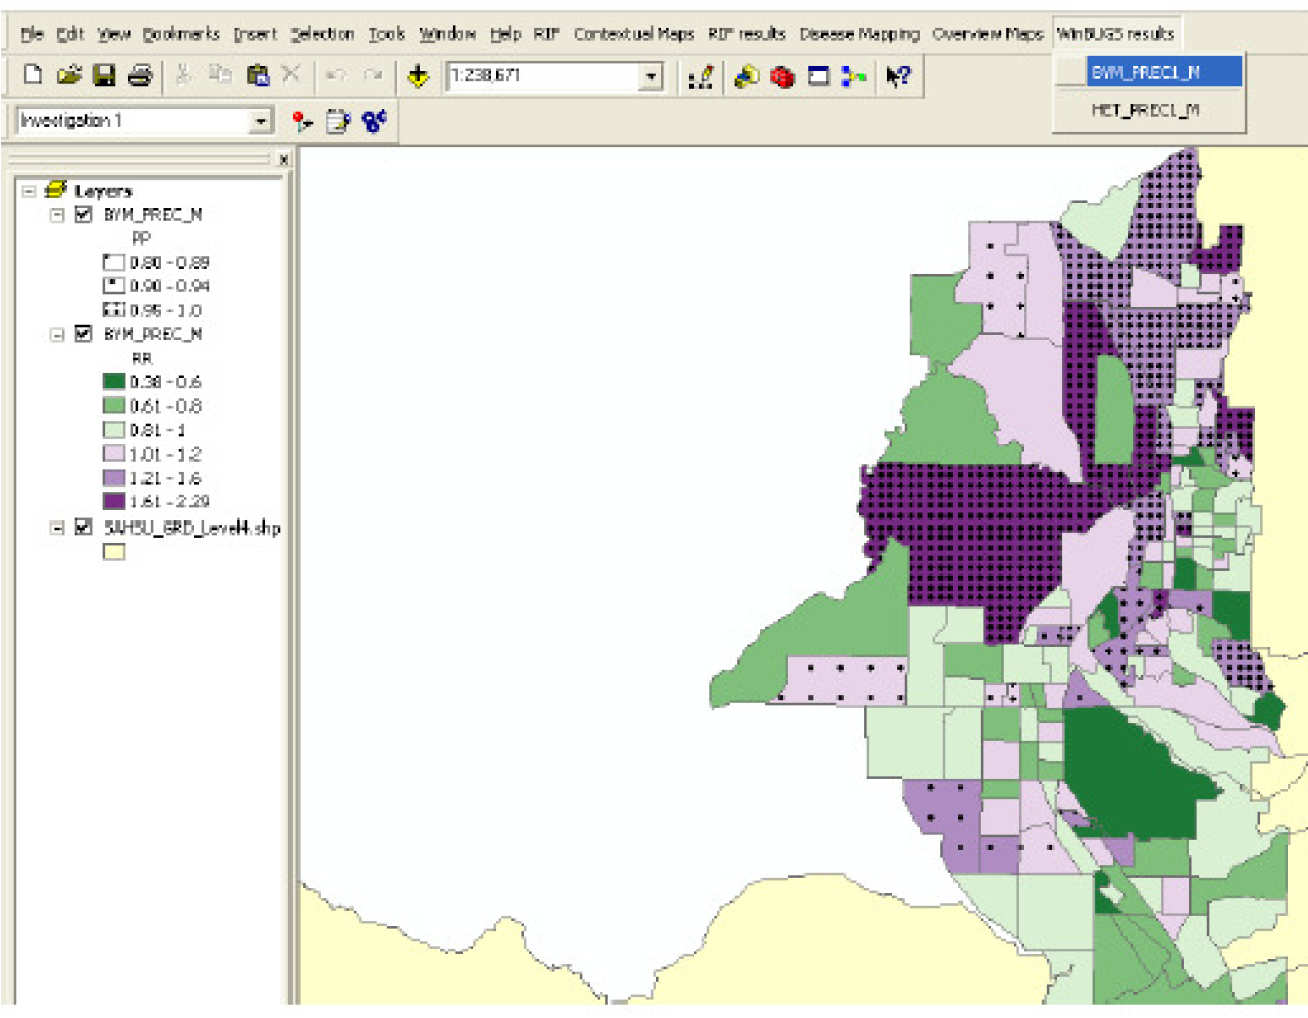
The software application was originally developed in the late 1990s by SAHSU staff. The most widely used RIF distribution (version 3.x) an embedded plug-in for ArcGIS 9.x has been employed by many institution and public health practitioners around the world to both automatically generate disease maps and asses disease risk in proximity to known source of pollution.
This software was developed as part of the EUROHEIS and EUROHEIS2 projects, funded by the European Commission’s Directorate for General Health and Consumer Protection. It also received funding from the US Center for Disease Control (CDC) as part of the [US] Environment and Health Public Tracking Program.
RIF 4.0:
The aim of these projects was to improve health information and analysis in order to assess relationships between environmental pollution and disease. In 2010 however due to changes in the ArgGIS software architecture the RIF 3.x ceased to function hence the need of a new version (RIF 4.0). This is currently being developed in collaboration with the US Center for Disease Control which has already provided funding for year 2013 and 2014.
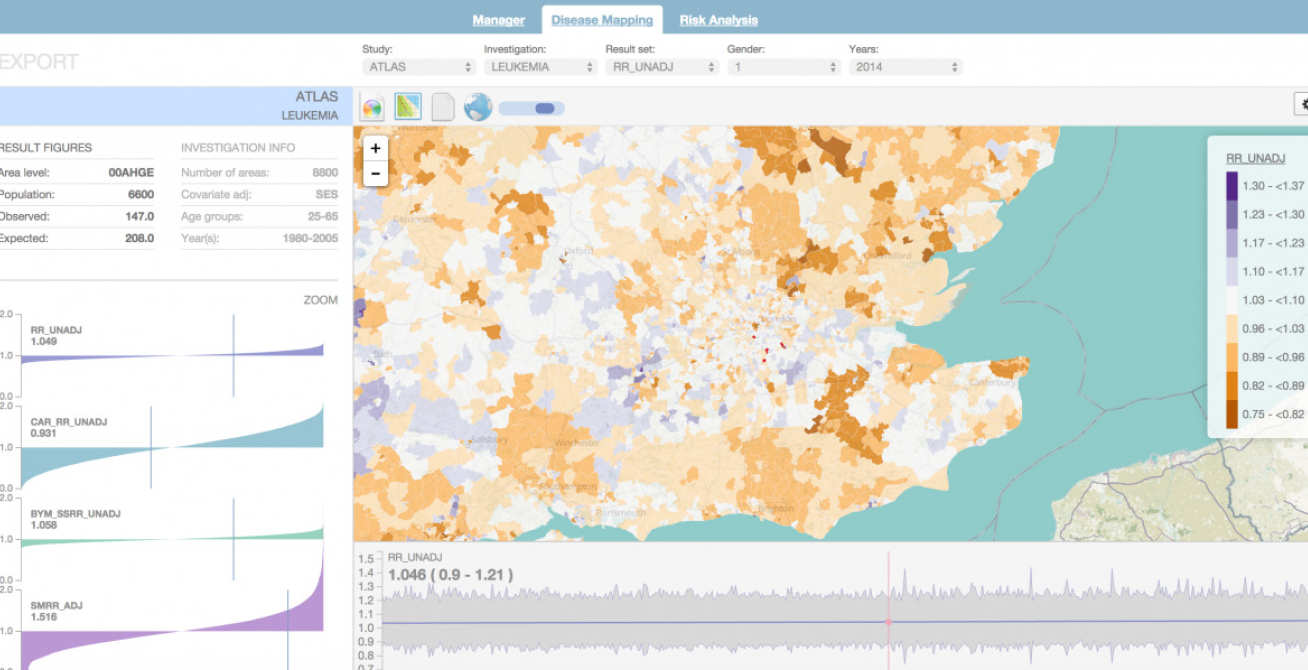
The RIF 4.0 is an open source, freely accessible web platform which can be used off and on-line. It uses a three layers framework in which all data can be stored locally or remotely on a spatially enabled database, PostGIS. This is directly linked to a Java middleware whose role is to check, validate and secure all communications between the graphical user interface, a JavaScript/HTML5 platform, and the database.
The RIF 4.0 integrates advanced methods in statistics, exposure assessment and data visualization. It is integrated with R and offers linkage to external software for the assessment of air pollution exposure and noise. Each block has been developed independently using a mixture of technologies which are connected together using an abstract interface (Middle layer).
The new platform is built upon the methods used on the widely used RIF 3.x version, an embedded plug-in for ArcGIS, which is no longer supported.
IT Administrators will appreciate the ability to generate an audit trail that will be created alongside result sets. The audit record will include the original query submission, the warning and error messages generated by running the query and summary statistics about the number of results that were returned by the database.
The development will also focus on optimising RIF performance on very large datasets to allow the RIF to be used on larger studies than at present. The new RIF will also be designed as a multi user application fully able to support the complex information governance requirements to keep research health databases secure.
Disease mapping demo:
RIF4 Disease Mapping Demo

More Information:
If you would like more information or to be notified when the new RIF 4.0 becomes available please email us at sahsu@imperial.ac.uk. If you’ d like to keep track of our progress in developing the RIF 4.0 you can visit our github repository.
References:
- P Aylin, R Maheswaran, J Wakefield, S Cockings, L Jarup, R Arnold, G Wheeler, P Elliott. A national facility for small area disease mapping and rapid initial assessment of apparent disease clusters around a point source: the UK Small Area Health Statistics Unit. J Public Health 1999; 21(3): 289-298. doi:10.1093/pubmed/21.3.289
- L Jarup. Health and Environment Information Systems for Exposure and Disease Mapping, and Risk Assessment. Environ Health Perspect 2004; 112(9): 995–997. doi: 10.1289/ehp.6736
- Juhasz A, Nagy C, Paldy A, Beale, L, 2009, Development of Deprivation Index and its relation to premature mortality due to diseases of circulatory system in Hungary, 1998-2004”, Social Science & Medicine, Elsevier, vol. 70(9), pages 1342-1349.
- Holowaty EJ, Norwood TA, Wanigaratne S, Abellan JJ, Beale L, 2010, International Feasibility and utility of mapping disease risk at the neighbourhood level within a Canadian public health unit: an ecological study. International Journal of Health Geographics, 9:21.
- L Beale, S Hodgson, JJ Abellan, S LeFevre, L Jarup. Evaluation of Spatial Relationships between Health and the Environment: The Rapid Inquiry Facility. Environ Health Perspect 2010;118:1306-1312.
RIF User Guide:
The RIF automatically generates contextual maps showing the area under study. A report is generated summarising the study details, and reporting the crude and adjusted rates and risks for each health outcome investigated. Graphs comparing the age, gender and socio-economic (or other covariate) structure of the study, and comparison populations, are provided to aid interpretation.
As well calculating the rates and relative risks (and associated 95% confidence intervals) for each exposure group or distance band, the RIF also runs Chi-square tests for homogeneity and linear trends to test the global association between distance/exposure covariate and disease risk. In disease mapping analyses, maps showing crude, adjusted and smoothed risks by area are also displayed. Demonstrations of the current RIF are available. These are large Windows Media Video (.wmv) files, and must first be unzipped (use WinZip on Windows), and then they can be viewed using Windows Media Player.
Benefits to Public:
The RIF has been widely disseminated, and used by public health departments in the USA, Canada and Europe. The RIF v4.0 will be freely available for application in any public health setting and with particular usefulness in initial epidemiological investigations of potential clusters of disease, in relation to environmental contamination such as around industrial sites, and disease surveillance.