Dinosaur-dooming asteroid struck Earth at ‘deadliest possible’ angle
Credit: Chase Stone
New simulations from Imperial College London have revealed the asteroid that doomed the dinosaurs struck Earth at the ‘deadliest possible’ angle.
The simulations show that the asteroid hit Earth at an angle of about 60 degrees, which maximised the amount of climate-changing gases thrust into the upper atmosphere.
Such a strike likely unleashed billions of tonnes of sulphur, blocking the sun and triggering the nuclear winter that killed the dinosaurs and 75 per cent of life on Earth 66 million years ago.
This was among the worst-case scenarios for the lethality on impact, because it put more hazardous debris into the upper atmosphere and scattered it everywhere – the very thing that led to a nuclear winter. Professor Gareth Collins Department of Earth Science and Engineering
Drawn from a combination of 3D numerical impact simulations and geophysical data from the site of the impact, the new models are the first ever fully 3D simulations to reproduce the whole event – from the initial impact to the moment the final crater, now known as Chicxulub, was formed.
Lead researcher Professor Gareth Collins, of Imperial’s Department of Earth Science and Engineering, said: “For the dinosaurs, the worst-case scenario is exactly what happened. The asteroid strike unleashed an incredible amount of climate-changing gases into the atmosphere, triggering a chain of events that led to the extinction of the dinosaurs. This was likely worsened by the fact that it struck at one of the deadliest possible angles.
“Our simulations provide compelling evidence that the asteroid struck at a steep angle, perhaps 60 degrees above the horizon, and approached its target from the north-east. We know that this was among the worst-case scenarios for the lethality on impact, because it put more hazardous debris into the upper atmosphere and scattered it everywhere – the very thing that led to a nuclear winter.”
The results are published in Nature Communications. The simulations, which used a 17-km diameter asteroid with a density of 2630 kgm3 and a speed of 12 km/s, were performed on the Science and Technology Facilities Council (STFC) DiRAC High Performance Computing Facility.
Crater creation
The upper layers of earth around the Chicxulub crater in present-day Mexico contain high amounts of water as well as porous carbonate and evaporite rocks. When heated and disturbed by the impact, these rocks would have decomposed, flinging vast amounts of carbon dioxide, sulphur and water vapour into the atmosphere.
The sulphur would have been particularly hazardous as it rapidly forms aerosols - tiny particles that would have blocked the sun’s rays, halting photosynthesis in plants and rapidly cooling the climate. This eventually contributed to the mass extinction event that killed 75 per cent of life on Earth.
The team of researchers from Imperial, the University of Freiburg, and the University of Texas at Austin, examined the shape and subsurface structure of the crater using geophysical data to feed into the simulations that helped diagnose the impact angle and direction. Their analysis was also informed by recent results from drilling into the 200 km-wide crater, which brought up rocks containing evidence of the extreme forces generated by the impact.
Peak performance
Large craters like Chicxulub are formed in a matter of minutes, and involve a spectacular rebound of rock beneath the crater. Dr Thomas Davison Department of Earth Science and Engineering
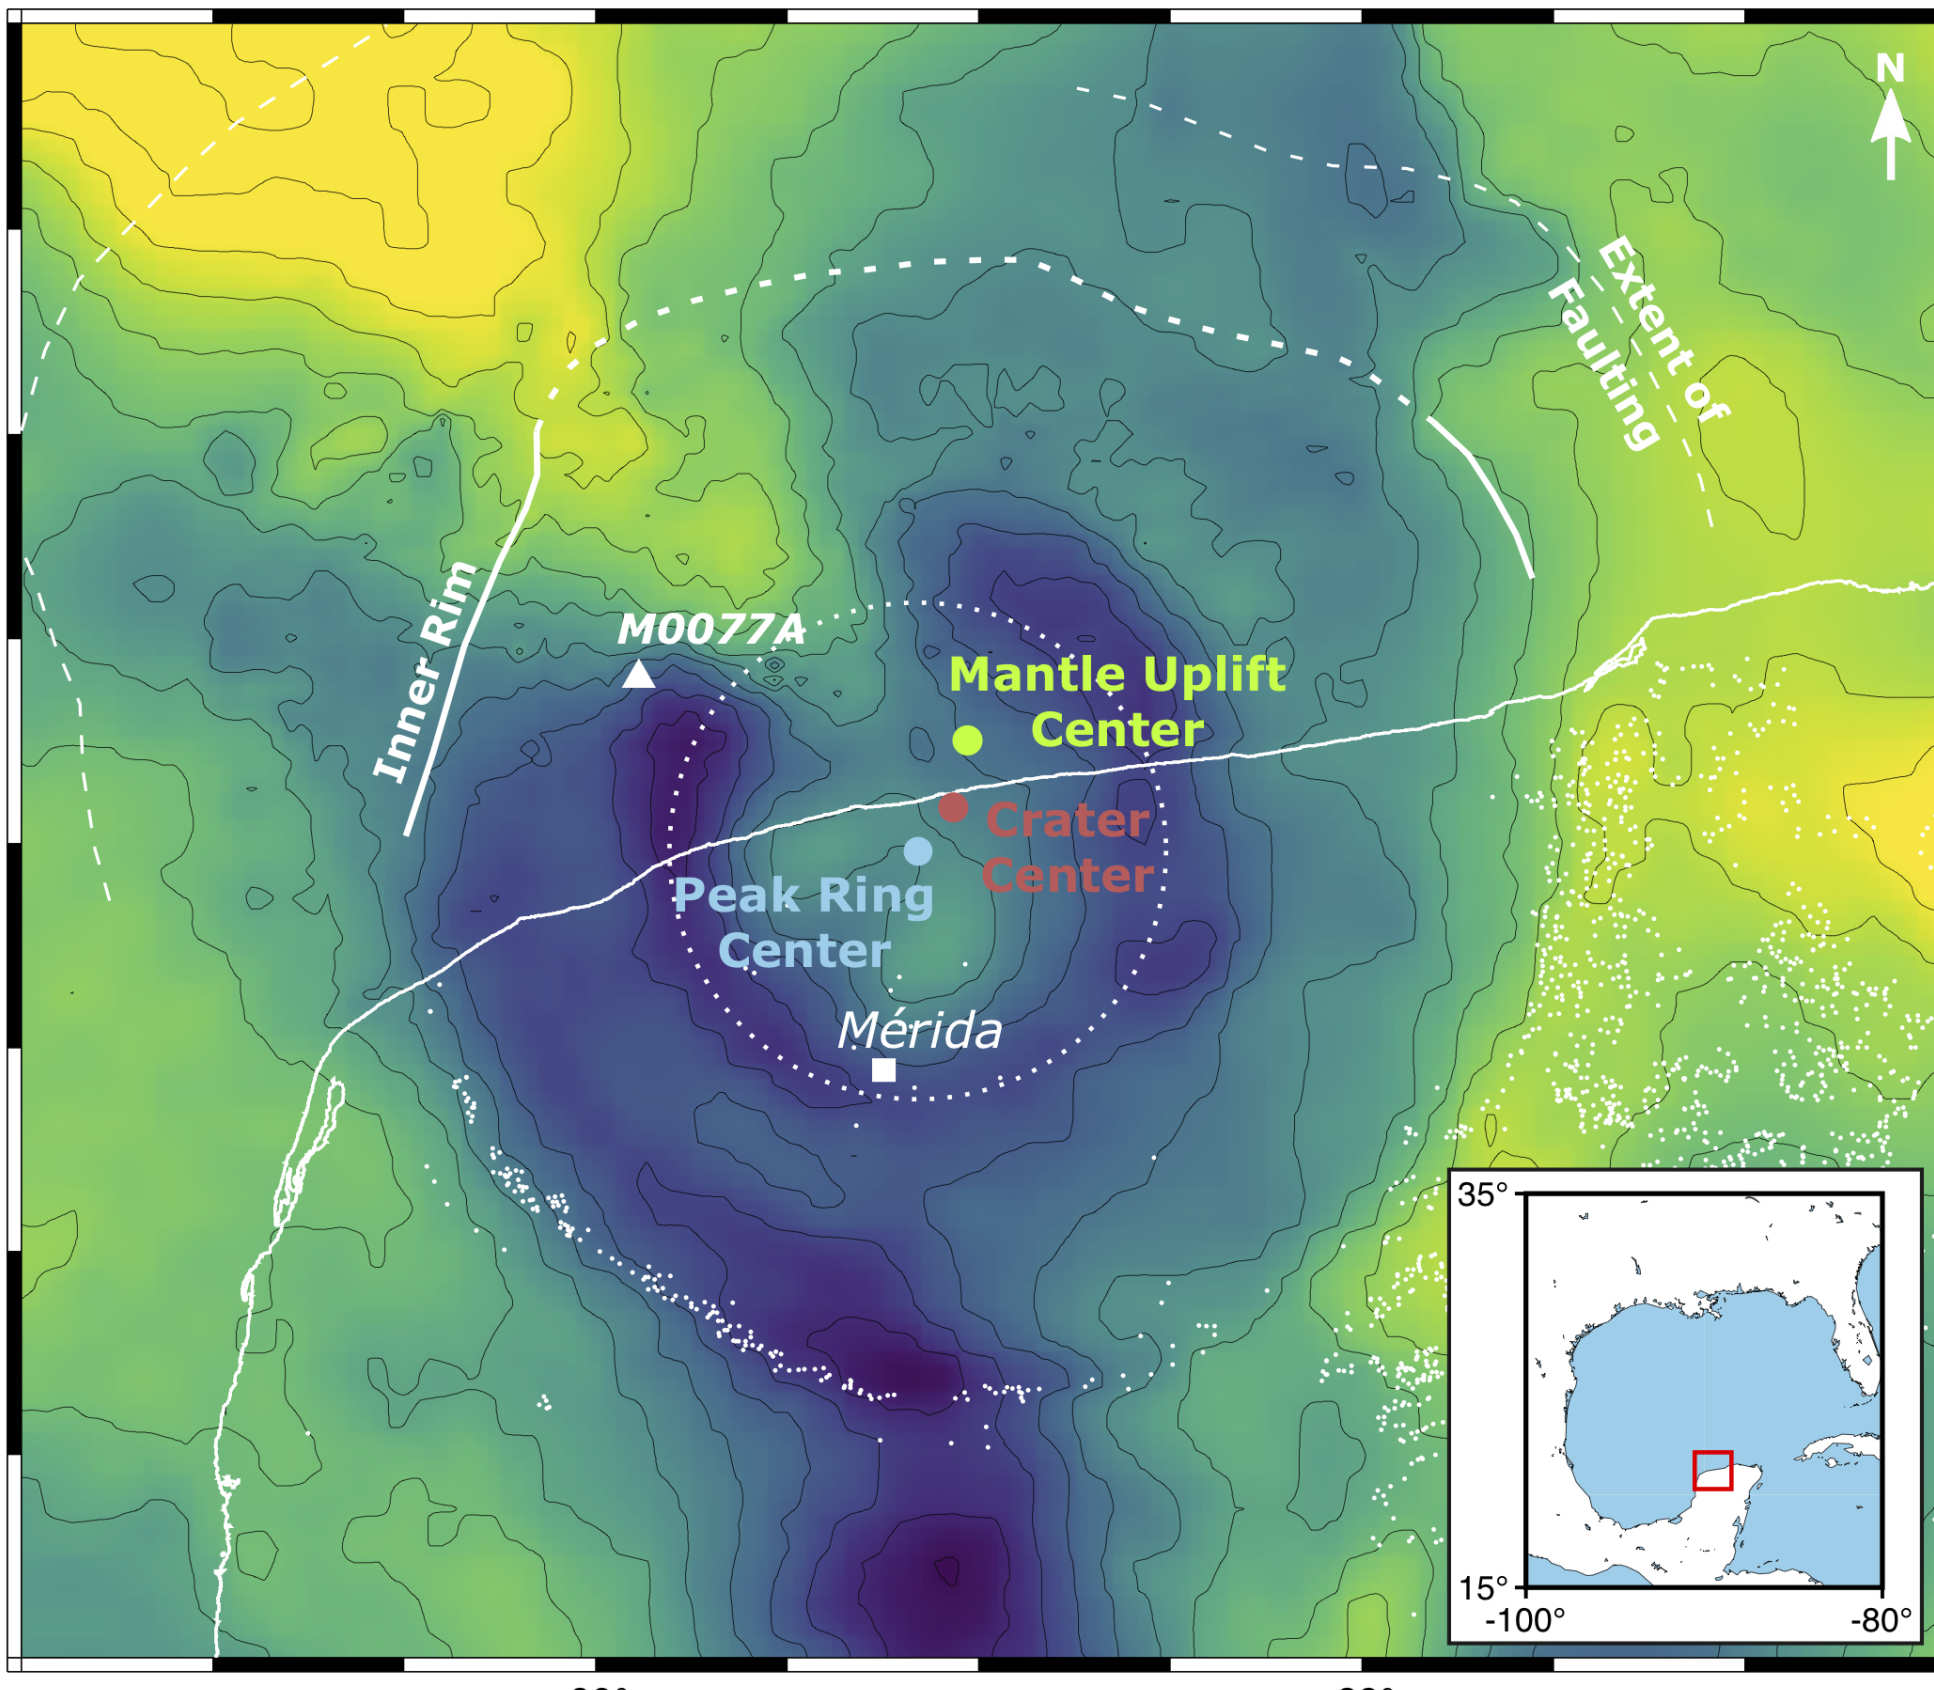
Pivotal to diagnosing the angle and direction of impact was the relationship between the centre of the crater, the centre of the peak ring - a ring of mountains made of heavily fractured rock inside the crater rim - and the centre of dense uplifted mantle rocks, some 30 km beneath the crater.
At Chicxulub, these centres are aligned in a southwest-northeast direction, with the crater centre in between the peak-ring and mantle-uplift centres. The team’s 3D Chicxulub crater simulations at an angle of 60 degrees reproduced these observations almost exactly.

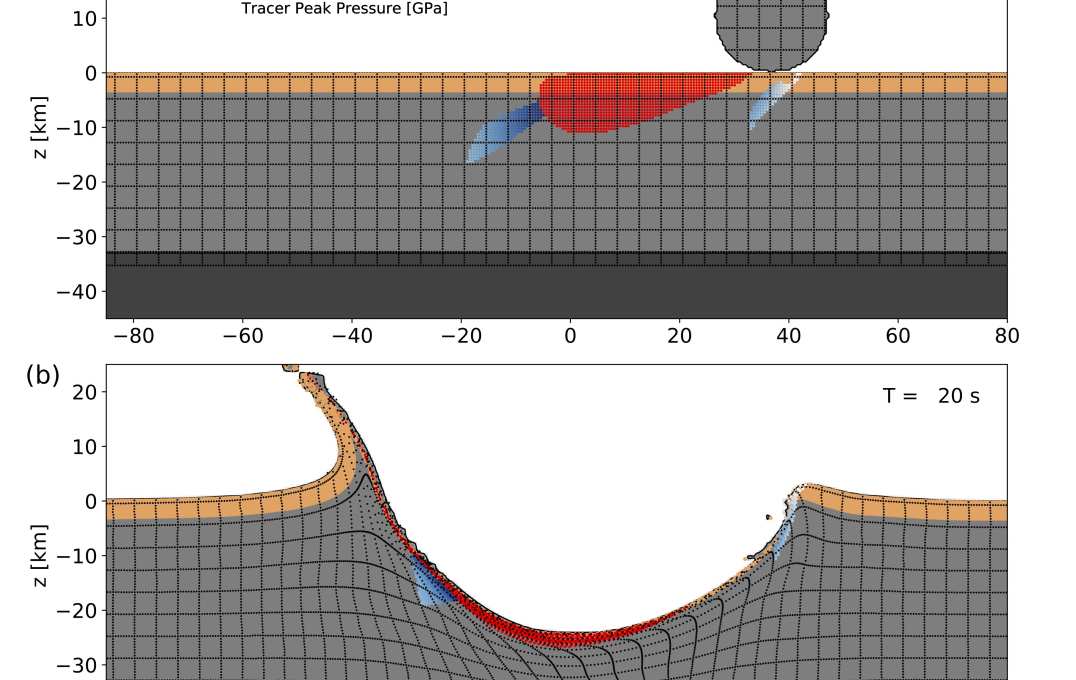
The simulations reconstructed the crater formation in unprecedented detail and give us more clues as to how the largest craters on Earth are formed. Previous fully 3D simulations of the Chicxulub impact have covered only the early stages of impact, which include the production of a deep bowl-shaped hole in the crust known as the transient crater and the expulsion of rocks, water and sediment into the atmosphere.
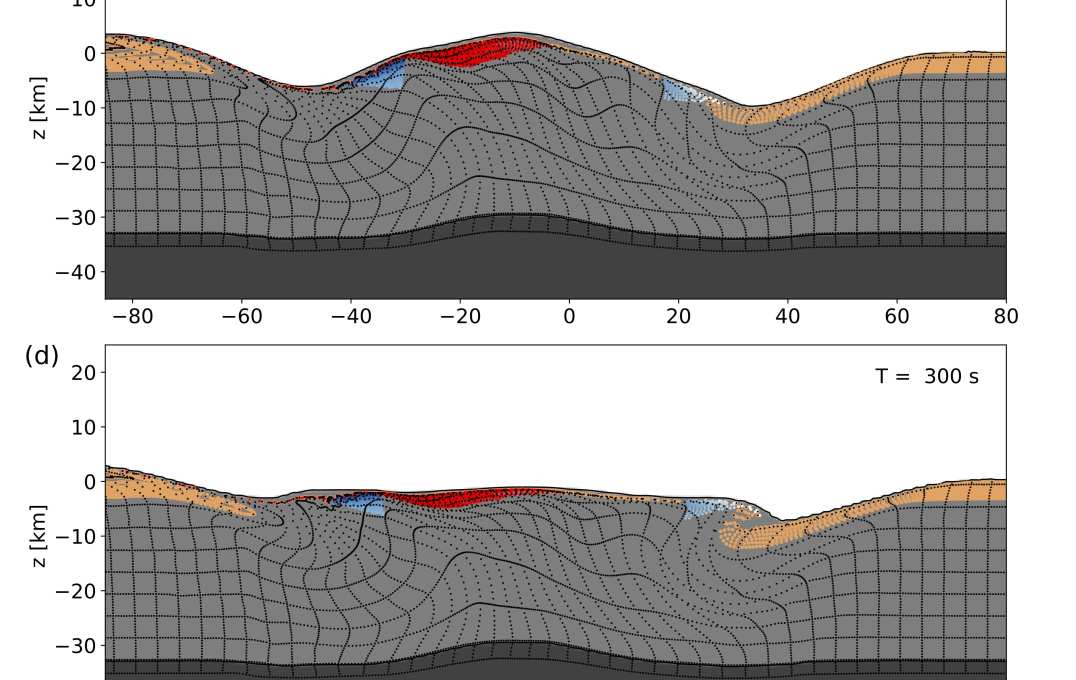
These simulations are the first to continue beyond this intermediate point in the formation of the crater and reproduce the final stage of the crater’s formation, in which the transient crater collapses to form the final structure (see video). This allowed the researchers to make the first comparison between 3D Chicxulub crater simulations and the present-day structure of the crater revealed by geophysical data.
Snapshot of the start of the simulation at 30° impact
Snapshot of the end of the simulation at 30° impact
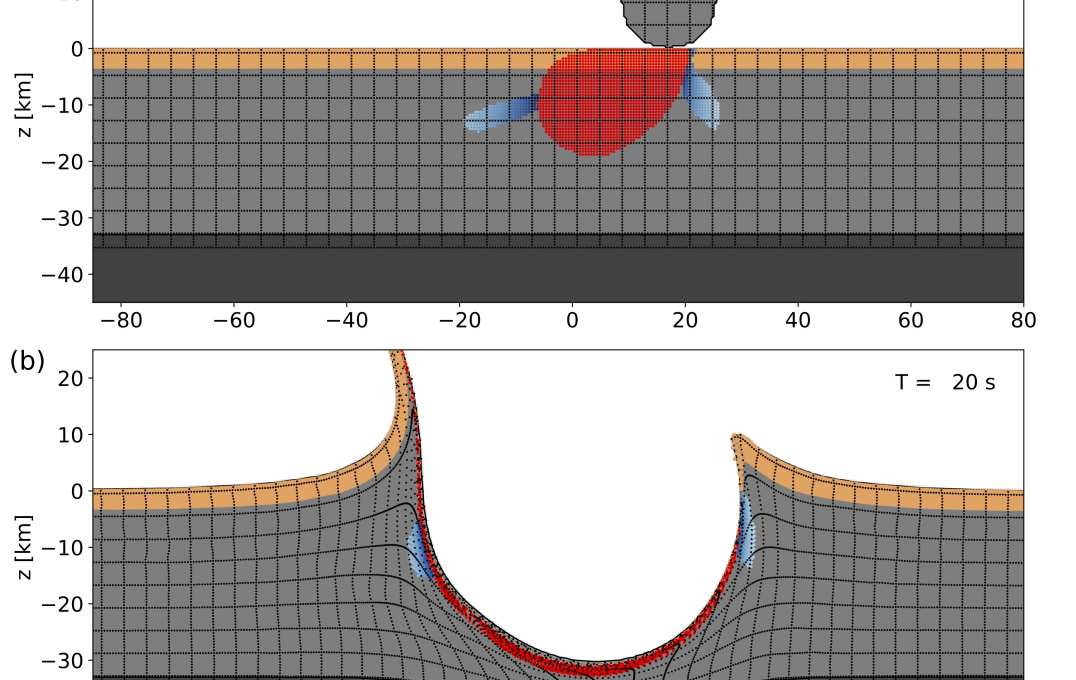
Snapshot of the start of the simulation at 60° impact
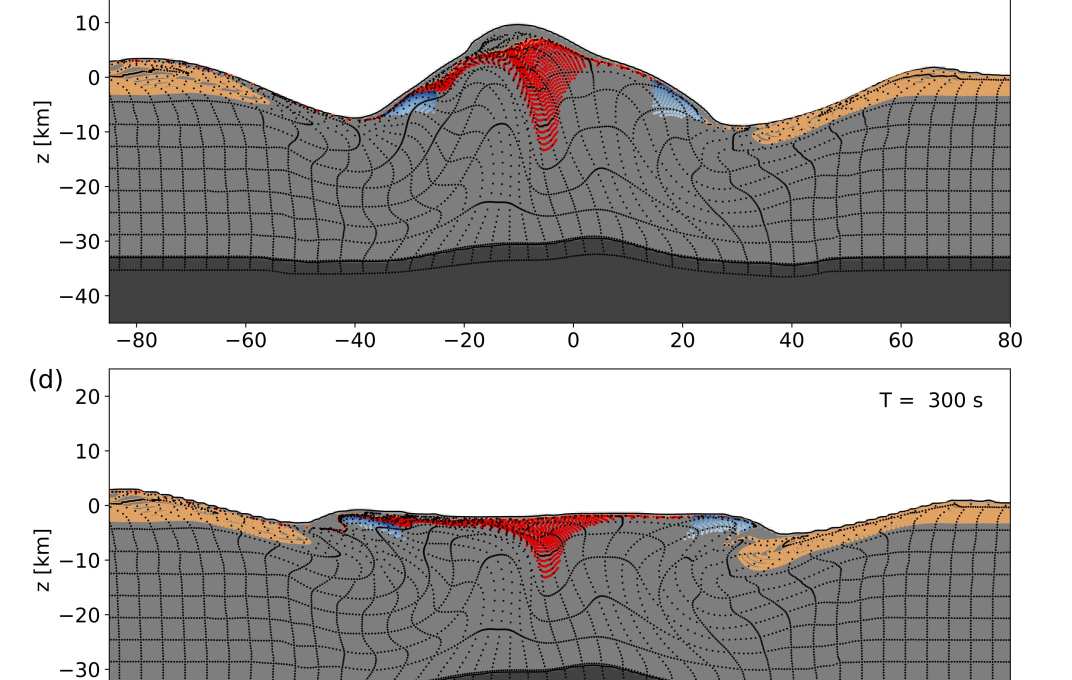
Snapshot of the end of the simulation at 60° impact
Co-author Dr Auriol Rae of the University of Freiburg said: “Despite being buried beneath nearly a kilometre of sedimentary rocks, it is remarkable that geophysical data reveals so much about the crater structure - enough to describe the direction and angle of the impact.”
The researchers say that while the study has given us important insights into the dinosaur-dooming impact, it also helps us understand how large craters on other planets form.
Co-author Dr Thomas Davison, also of Imperial’s Department of Earth Science and Engineering, said: “Large craters like Chicxulub are formed in a matter of minutes, and involve a spectacular rebound of rock beneath the crater. Our findings could help advance our understanding of how this rebound can be used to diagnose details of the impacting asteroid.”
The work was supported by the International Ocean Discovery Program (IODP), International Continental Scientific Drilling Program (ICDP), (STFC) DiRAC High Performance Computing Facility and the Natural Environment Research Council.
“A steeply-inclined trajectory for the Chicxulub impact” G. S. Collins, N. Patel, T. M. Davison, A. S. P. Rae, J. V. Morgan, S. P. S. Gulick, IODP-ICDP Expedition 364 Science Party.
CREDITS
Main image of asteroid and dinosaurs: Chase Stone
All other images and video: Gareth Collins/Imperial College London
Article supporters
Article text (excluding photos or graphics) © Imperial College London.
Photos and graphics subject to third party copyright used with permission or © Imperial College London.
Reporter
Caroline Brogan
Communications Division