


NSS 2013
Key messages for NSS 2013
- The College’s Overall Satisfaction has increased to 87% (+1% from 2012). This is 2% above the sector average.
- The College was ranked 55th in the sector for Overall Satisfaction.
- For all question categories the College has a higher percentage satisfaction than 2012. The greatest increases were in Assessment and Feedback and Academic Support (both +4%), and for the Students' Union (+6%).
- Of the 14 College subjects surveyed, 9 have increased their Overall Satisfaction from 2012, 4 have decreased and 1 remained the same. The range is from 80% (Life Sciences) to 100% (ESE) Overall Satisfaction.
- The College had a higher level of Overall Satisfaction than the sector average in 9 NSS subjects.
- The following College subjects were ranked 1st in the sector for Overall Satisfaction: Chemical Engineering and Earth Science and Engineering.
- The overall College response rate was 81% (+10% on 2012) with 1634 respondents.
Institutional level results
Question category results
The College improved its re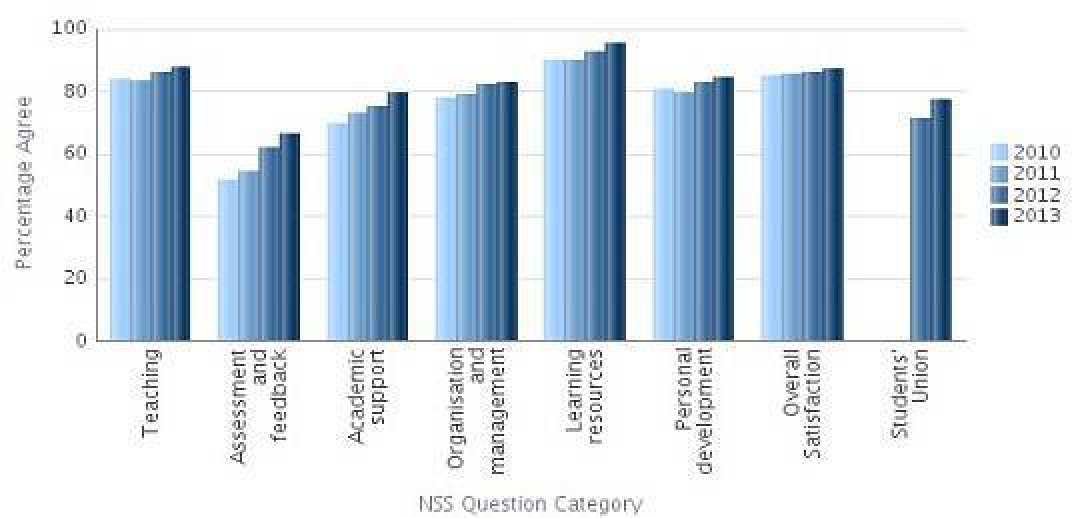 sults in all of the NSS question categories, maintaining the upward trend from 2011 to 2012. This graph shows the percentage agree for the last four years in the eight question categories. The Students' Union was a new category for 2012.
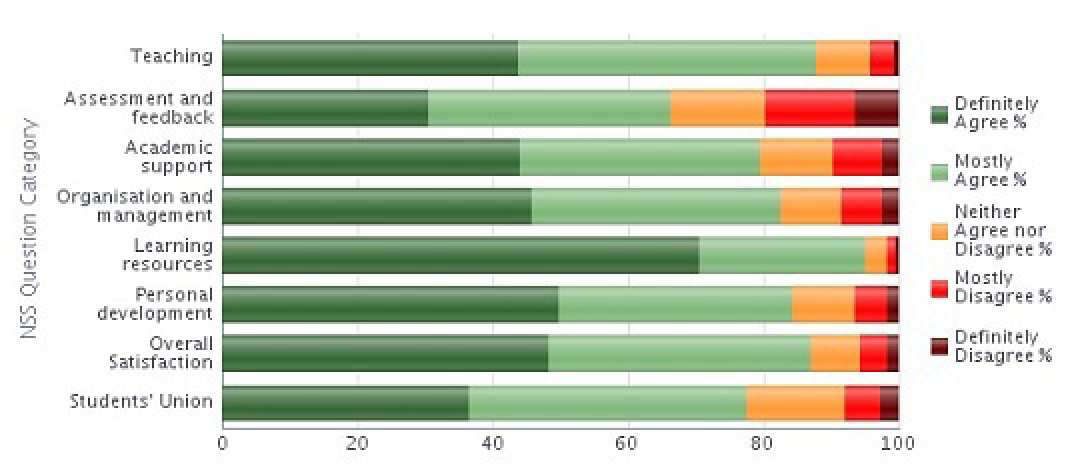
This graph shows the results for the NSS question categories in 2013 broken down by the five possible responses to questions (Strongly Agree, Slightly Agree, Neither Agree nor Disagree, Slightly Disagree, Strongly Disagree). The percentage agree is the proportion of respondents answering Strongly Agree or Slightly Agree to a question.
Individual questions
The table below shows the 2013 results for the College for each NSS question, with the change in percentage satisfaction from the previous two surveys. In 2013 the College had a higher percentange satisfaction than 2012 for 21 out of 23 questions. Satisfaction for the remaining two questions was unchanged.
| NSS Question | % Agree in 2013 | Change since 2012 | Change since 2011 |
|---|---|---|---|
| Teaching | 88 | +2 | +5 |
| Staff are good at explaining things | 90 | +1 | +4 |
| Staff have made the subject interesting | 82 | +2 | +6 |
| Staff are enthusiastic about what they are teaching | 88 | +2 | +6 |
| The course is intellectually stimulating | 91 | +1 | +2 |
| Assessment and Feedback | 66 | +4 | +12 |
| The criteria used in marking have been clear in advance | 75 | +7 | +16 |
| Assessment arrangements and marking have been fair | 77 | +2 | +9 |
| Feedback on my work has been prompt | 64 | +4 | +12 |
| I have received detailed comments on my work | 57 | +4 | +11 |
| Feedback on my work has helped me clarify things I did not understand |
57 | +2 | +11 |
| Academic support | 79 | +4 | +6 |
| I have received sufficient advice and support with my studies | 74 | +3 | +9 |
| I have been able to contact staff when I needed to | 88 | +4 | +4 |
| Good advice was available when I needed to make study choices | 77 | +7 | +9 |
| Organisation and management | 83 | +1 | +4 |
| The timetable works efficiently as far as my activities are concerned | 83 | 0 | +4 |
| Any changes in the course or teaching have been communicated effectively | 83 | +1 | +6 |
| The course is well organised and is running smoothly | 82 | 0 | +1 |
| Learning resources | 95 | +3 | +5 |
| The library resources and services are good enough for my needs | 96 | +1 | +3 |
| I have been able to access general IT resources when I needed to | 97 | +3 | +6 |
| I have been able to access specialised equipment, facilities or rooms when I needed to | 93 | +5 | +8 |
| Personal development | 84 | +1 | +4 |
| The course has helped me to present myself with confidence | 81 | +1 | +4 |
| My communication skills have improved | 84 | +1 | +5 |
| As a result of the course, I feel confident in tackling unfamiliar problems | 87 | +1 | +5 |
| Overall Satisfaction | 87 | +1 | +2 |
| Overall, I am satisfied with the quality of the course. | 87 | +1 | +2 |
| Students' Union | 77 | +6 | - |
| I am satisfied with the Students' Union at my institution | 77 | +6 | - |
| Response rate | 81 | +10 | +23 |
Sector comparison
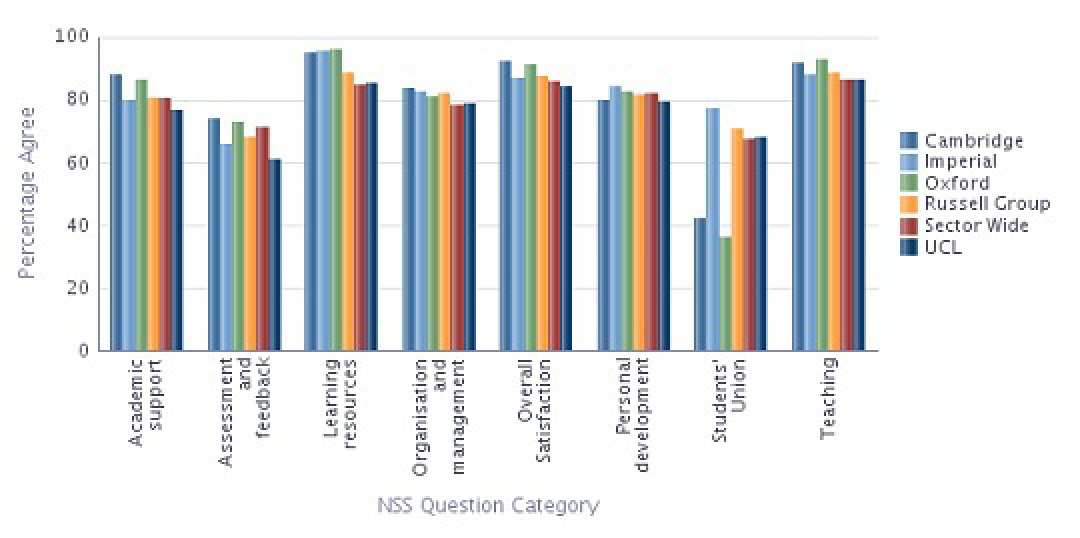 This graph shows the NSS 2013 results for the College and key competitors by question category.
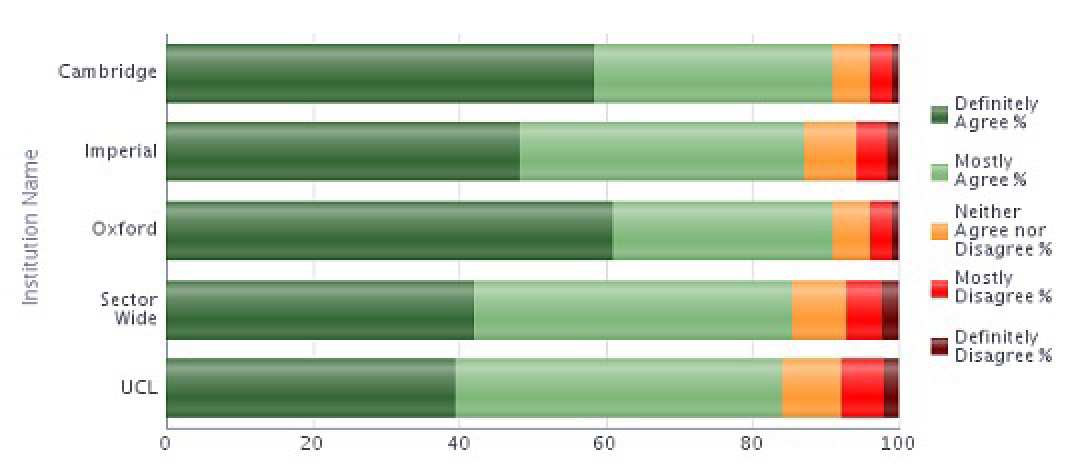
This graph shows a breakdown of the responses for Overall Satisfaction for Imperial and key competitors.
Comments
The National Student Survey (NSS) provides space for students to provide overall positive and overall negative comments about their experience. Details of the comments College students made can be found on the Comments page (internal only).
Subject level results
Select the link below to view the NSS 2013 results for that subject by Question Category, with comparison with previous years and the sector.
Faculty of Engineering
- Aeronautics
- Bioengineering
- Chemical Engineering
- Civil and Environmental Engineering
- Computing
- Earth Science and Engineering
- Electrical and Electronic Engineering
- Materials
- Mechanical Engineering
Faculty of Natural Sciences
Faculty of Medicine
Action plans
The College's action plans based on the results of NSS 2013 are available here: NSS 2013 action plans (internal only pdf).