Published October 2025. Updated November 2025.
Please note this study has been updated since its original publication and includes new data and analysis on rainfall and economic impact attribution. Access the originally published study: Hurricane Melissa October 2025
Summary
Melissa was one of the most powerful landfalling hurricanes ever recorded. The IRIS model estimates that climate change increased the maximum wind speed by 7% and the economic damage by 34%. A “Melissa” type hurricane at landfall is about four times more likely in the 2025 climate compared to a pre-industrial baseline.
| Maximum wind speed | Eyewall rainfall rate | Economic damage | |
|---|---|---|---|
| +1.3°C | +7% | +16% | +34% |
| +2.0°C | +9% | +21% | +43% |
Table 1. Changes of maximum wind speed at landfall, eyewall rainfall rate at landfall and the economic damage relative to the pre-industrial baseline for Hurricane Melissa.
Background
Hurricane Melissa was Category 5 with a reported life-time minimum pressure of 892 hPa, making it one of the strongest storms ever recorded. Melissa was an exceptionally strong Category 5 hurricane at landfall in Jamaica on the 28th of October 2025.
The IRIS model (Sparks and Toumi, 2024) is used to infer the additional strengthening of a “Melissa” type storm that can be attributed to recent warming or more specifically to recent changes in potential intensity (PI). For the warming scenarios the observed changes in potential intensity are scaled by the global mean surface temperature as described by Sparks and Toumi (2025).
Maximum wind speed at landfall
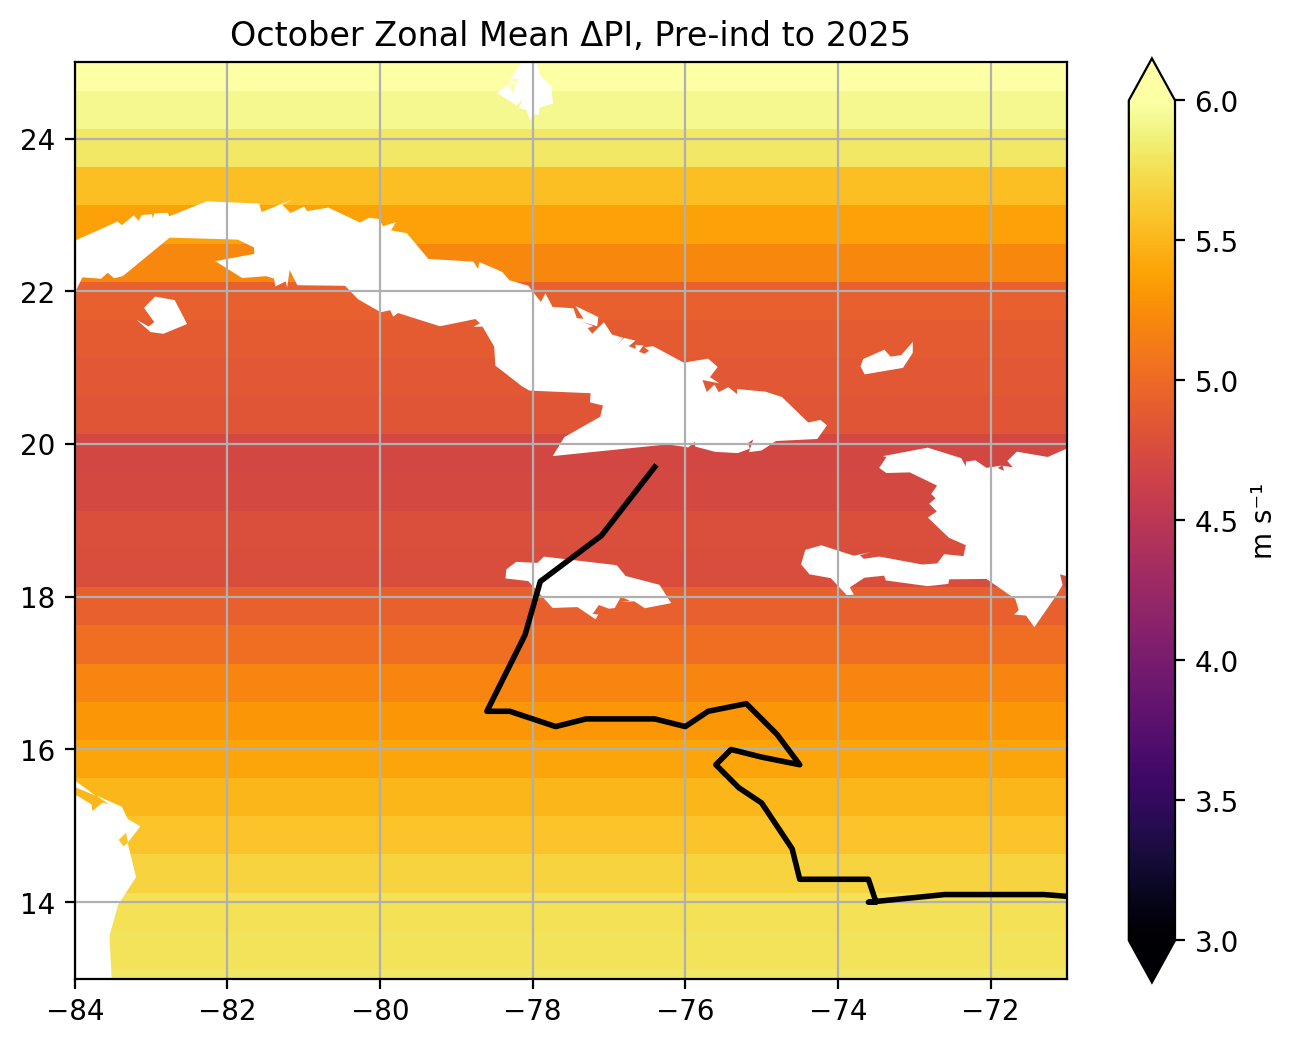
Figure 1 shows the zonal mean difference in October PI between 2025 and the pre-industrial estimate. The PI difference between 2025 and pre-industrial is about +5-6 m/s in the Caribbean. The frequency of landfall is the next consideration. The IRIS model calculates the intensity along the observed storm tracks for a 100,000-year simulation.
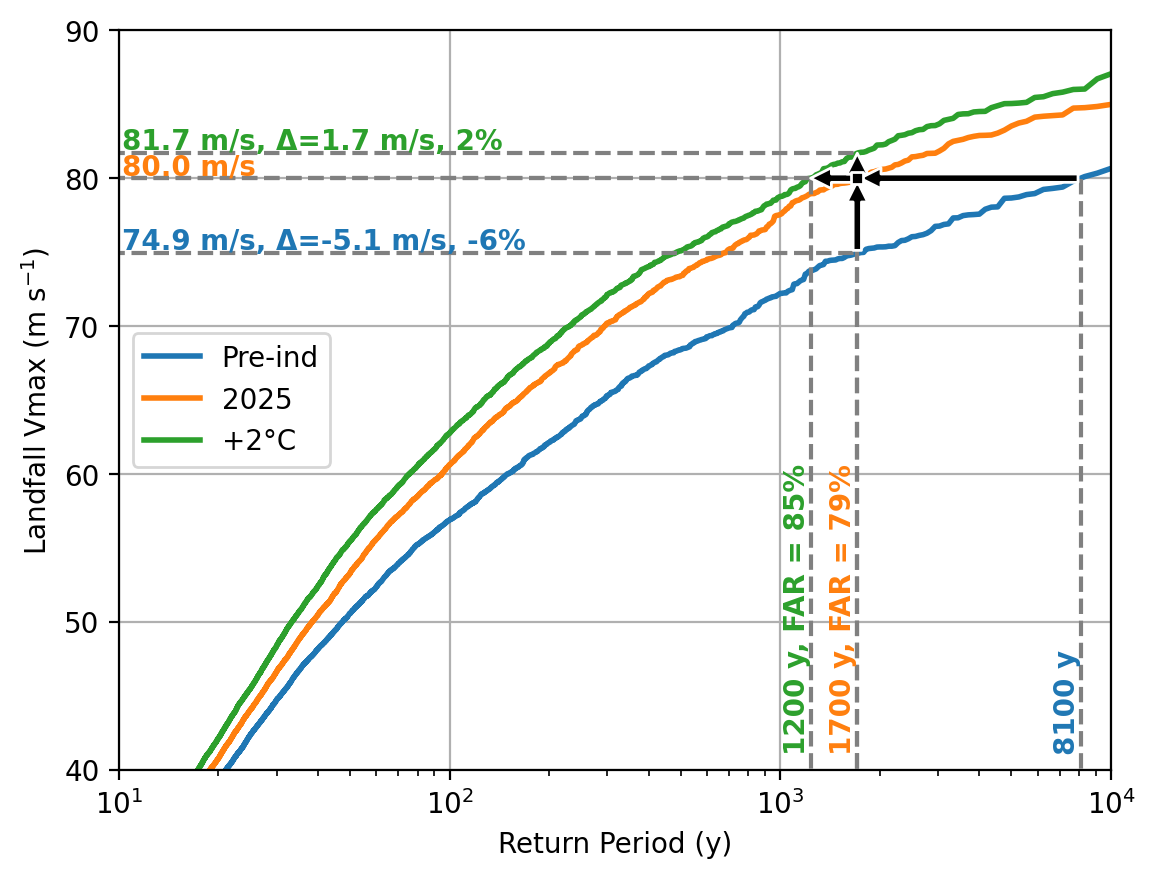
Figure 2 shows the model return period plot for hurricane landfall wind speeds in Jamaica. In the case of Melissa, a Category 5 at landfall, we estimate that this type of event was about four times more likely compared to pre-industrial times: the return period has decreased from 8100 yrs to 1700 yrs. For the same return period, the current wind speed compared to pre-industrial events has increased by 5.3 m/s or 7%. In a +2°C degree warmer world, the landfall wind speed increases by a further +2.1 m/s compared to the current climate (+1.3°C).
In the climate change attribution literature the fractional attributable risk, FAR, is frequently used. FAR is here defined as
| FAR = (Pnow - PPre-Ind) / Pnow | (1) |
|---|
where Pnow and PPre-Ind are the probabilities of an event of the minimum intensity for the current (now) and pre-industrial (Pre-Ind) climate respectively. The FAR for “Melissa ” type is 0.79. This means that at least 79% of the likelihood of this type of event can be attributed to climate change. It is unlikely that Melissa would have happened without climate change.
Eyewall rain rate at landfall
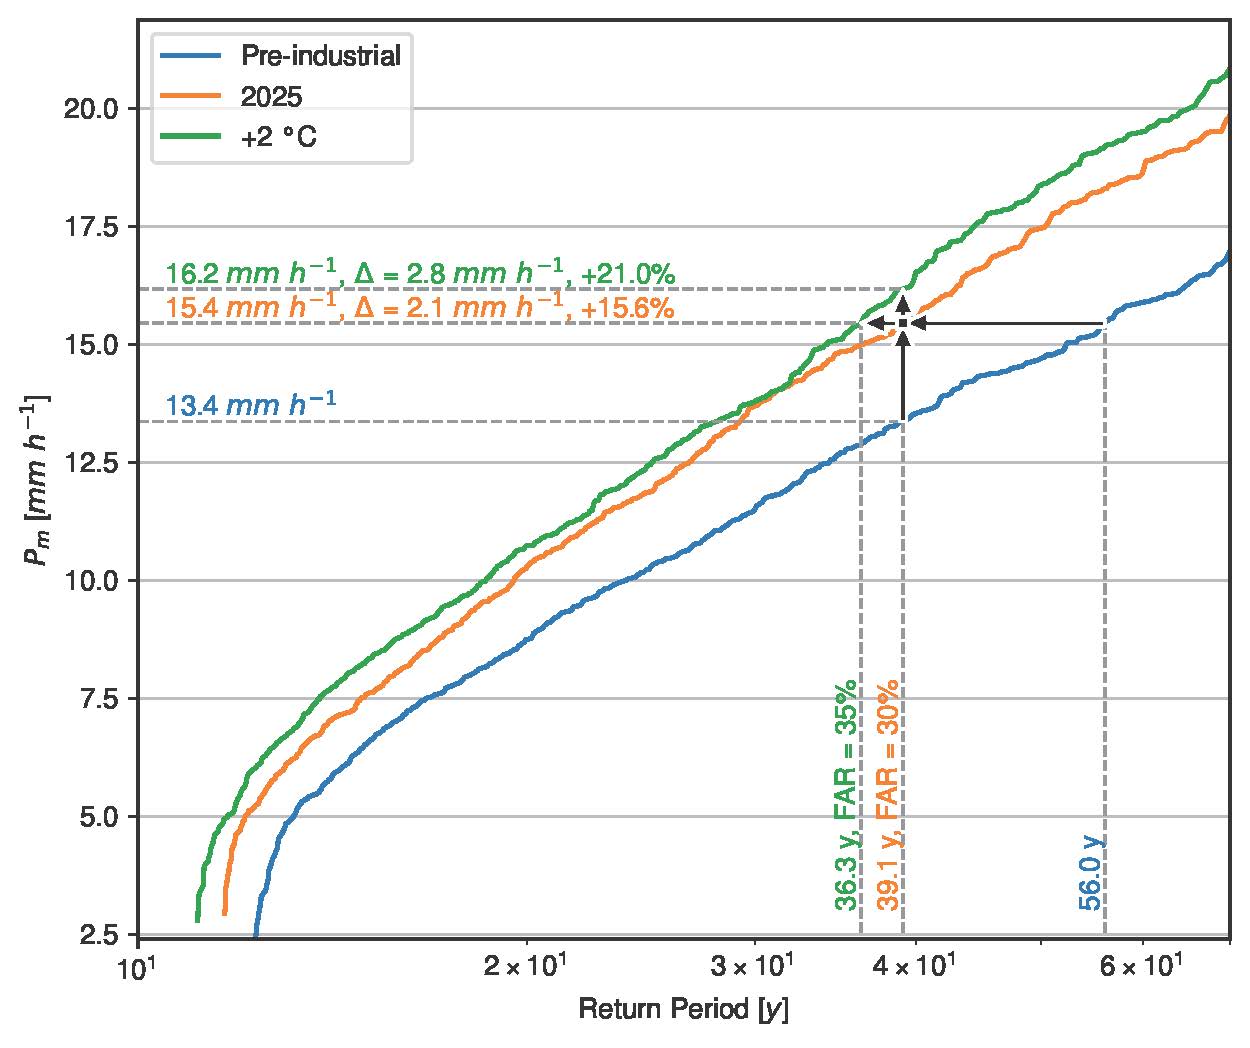
We also calculate the change of the hurricane eyewall rain rate as described by (Lau et al., 2025). The observed value of 15.4 mm/h is calculated as the maximum azimuthal mean rain rate at landfall from IMERG. Figure 3 shows the model return period of hurricane eyewall rain rate (maximum azimuthal mean) for Jamaica. We estimate that this type of event was about 43.3% more likely compared to pre-industrial times. The return period has decreased from 56.0 yrs to 39.1 yrs. For the same return period the current rain rate compared to pre-industrial events has increased by 2.1 mm/h or 15.6%. In a +2°C degree warmer world, the landfall eyewall rain rate increases by a further 0.7 mm/h, which amounts to a 21.0% increase compared to pre-industrial events. The FAR for “Melissa” type rain rate is 0.30. This means that at least 30% of the likelihood of this type of event can be attributed to climate change.
Attributing direct economic damage
We make an estimate of economic damage on physical assets. We combine reported wind fields with damage functions (Eberenz et al. 2021) and 10 km gridded exposure adjusted for population growth and inflation (Eberenz et al. 2020). For the damage functions we apply a minimum wind threshold for damage of 25.7 m/s and a half-damage wind speed range of 70-100 m/s reflecting the uncertainty. To deal with this damage uncertainty we simulate thousands of damages following the track by varying the damage function. Wind is used as a proxy for tropical cyclone hazard and the damage function indirectly accounts for the other perils such as storm surge and flood.
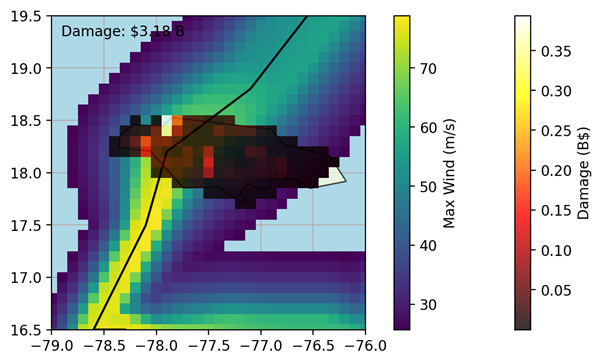
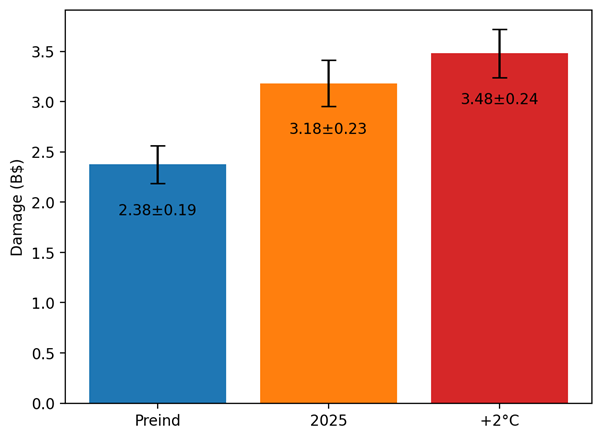
Figure 4 shows the wind footprint and the mean economic damages estimated. We then apply the landfall wind speeds for pre-industrial conditions and for a +2 °C global warming (see Figure 2). The pre-industrial and +2 °C simulations are for counterfactual scenarios assuming the current exposure and vulnerability and that only the wind speed is different. We find the wind speed increase makes substantially more damage. To communicate the effect of climate change on loss we define the fractional attributable loss, FAL:
|
FAL = (Lnow-LPre-Ind)/Lnow |
(2) |
|---|
where L is the economic loss for the current (now) and pre-industrial climate (Pre-Ind). For the mean damage, we estimate the FAL is 0.25. This means about 25% of the economic damage can be attributed to climate change compared to the pre-industrial baseline. The damage was increased by 34%. The future additional damage in a +2°C degree warmer world is an additional +9% from the current damages shown in Figure 5.
Eberenz, S., Stocker, D., Röösli, T., and Bresch, D. N.: Asset exposure data for global physical risk assessment, Earth Syst. Sci. Data, 12, 817–833, https://doi.org/10.5194/essd-12-817-2020, 2020.
Eberenz, S., Lüthi, S., and Bresch, D. N.: Regional tropical cyclone impact functions for globally consistent risk assessments, Nat. Hazards Earth Syst. Sci., 21, 393–415, https://doi.org/10.5194/nhess-21-393-2021, 2021.
Lau, K.H, Czernichow, S., Sparks, N., Toumi, R., A parametric rain model for landfalling tropical cyclones: A case study for the U.S., submitted Natural Hazards, 2025.
Sparks, N., Toumi, R. The Imperial College Storm Model (IRIS) Dataset. Sci Data 11, 424. https://doi.org/10.1038/s41597-024-03250-y, 2024.
Sparks, N., Toumi , R., The impact of global warming on U.S. hurricane landfall: a storyline approach. Environ. Res. Lett. 20 114006 https://doi.org/10.1088/1748-9326/ae0956, 2025.