Visualisation Case Studies
All the visualisation case studies below were developed by researchers at the DSI or DSI Academic and Affiliate Fellows.
Visit how to book the DO to see some of the visualisations first hand!
Visualisation Case Studies
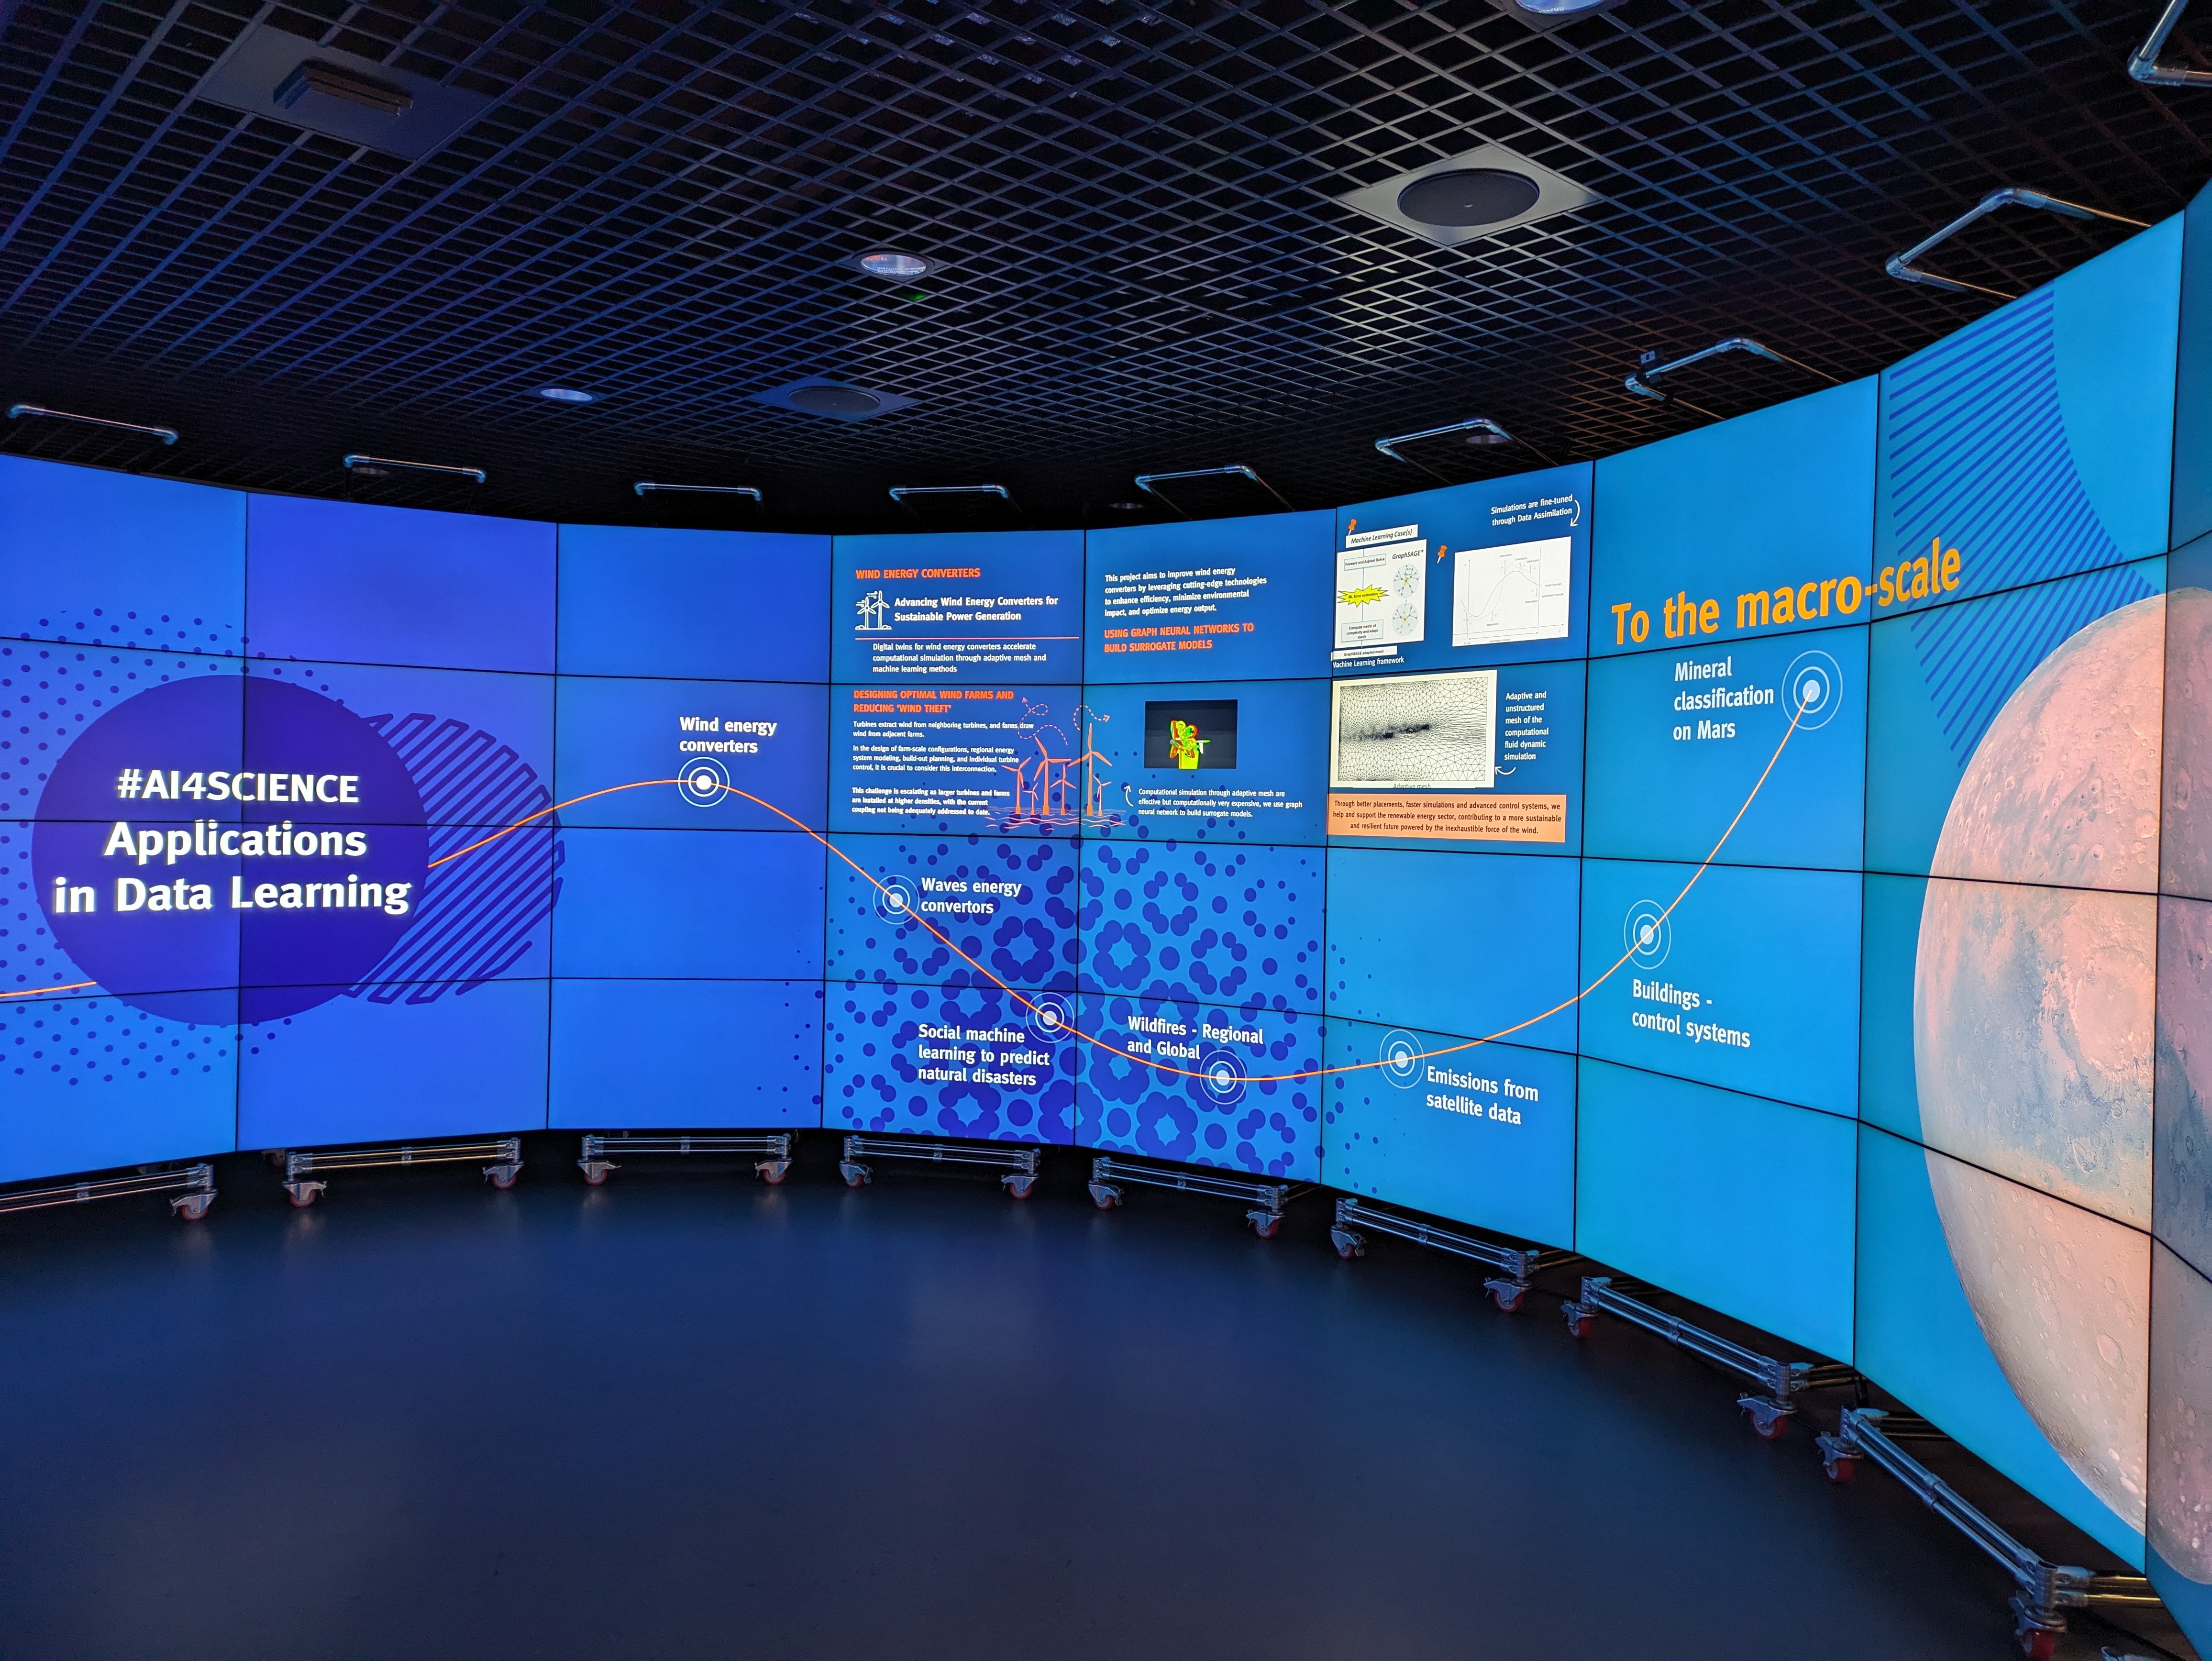
AI4Science: Data Learning Across Scales
This demo features work from the Data Learning Group – an interdisciplinary group at Imperial that uses digital twins and data assimilation to model real-world observations, with machine learning used to increase the reliability of predictions made by forecasting models.
Their research spans a wide range of applications which transcend scales, from the micro, such as droplet formation, to the macro, such as natural disaster prediction or mineral classification on Mars.
Find out more about the Data Learning Group.
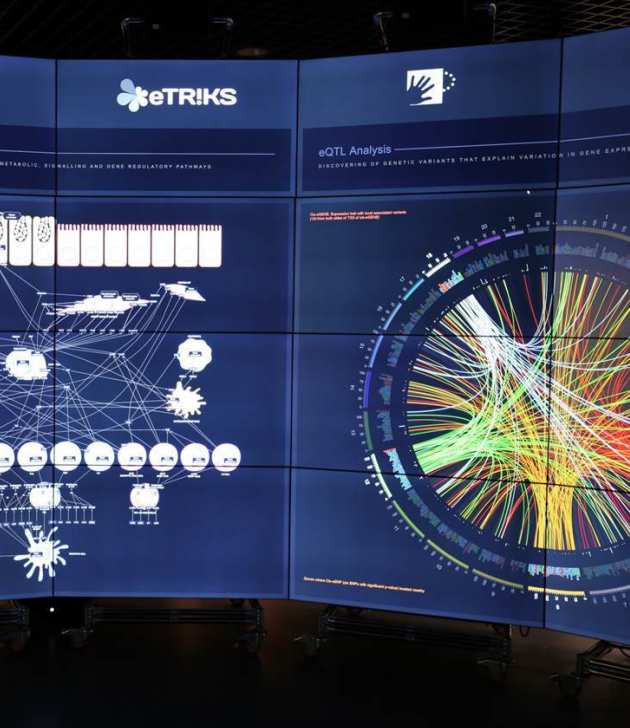
Bioinformatic Analysis of Severe Asthma

Bitcoin
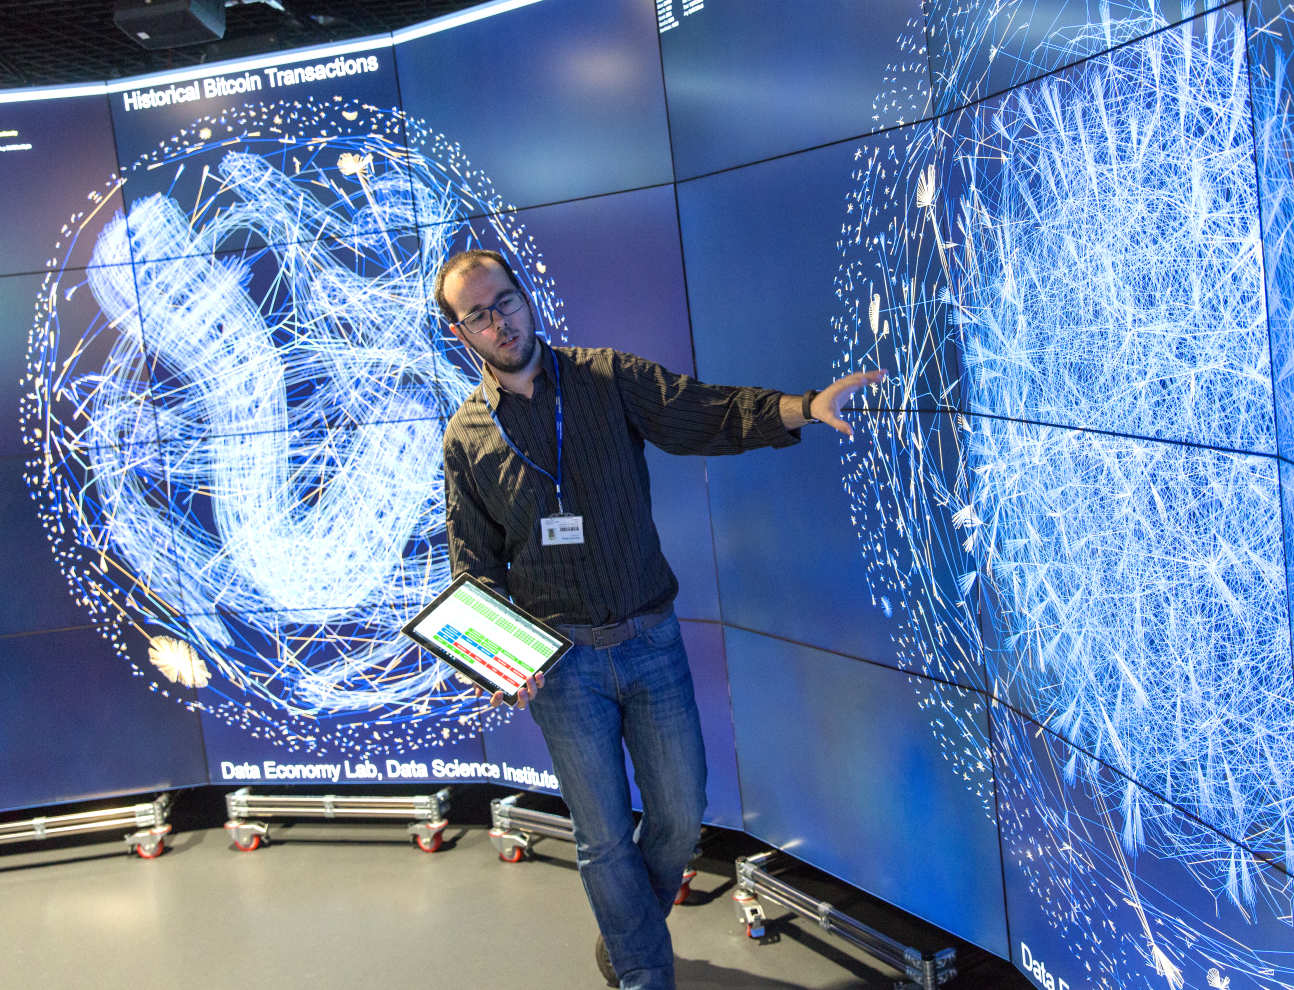
Every transaction conducted in the Bitcoin network is recorded permanently and irrevocably in a public database known as the Blockchain. By visualizing this network of highly associated data in a large scale environment we are able to accelerate algorithmic discovery of anomalous transactional patterns, with obvious applications into areas such as fraud detection.
Real time obseravtory on the different patterns of transactions that occur on the bitcoin network.
It also features some past blocks which contains relevant, unusual activity
If you want to read further about Bitcoin through a Master's student's visit, please click here.
Please read the publication Visualizing Dynamic Bitcoin Transaction Patterns written by our researchers, here.

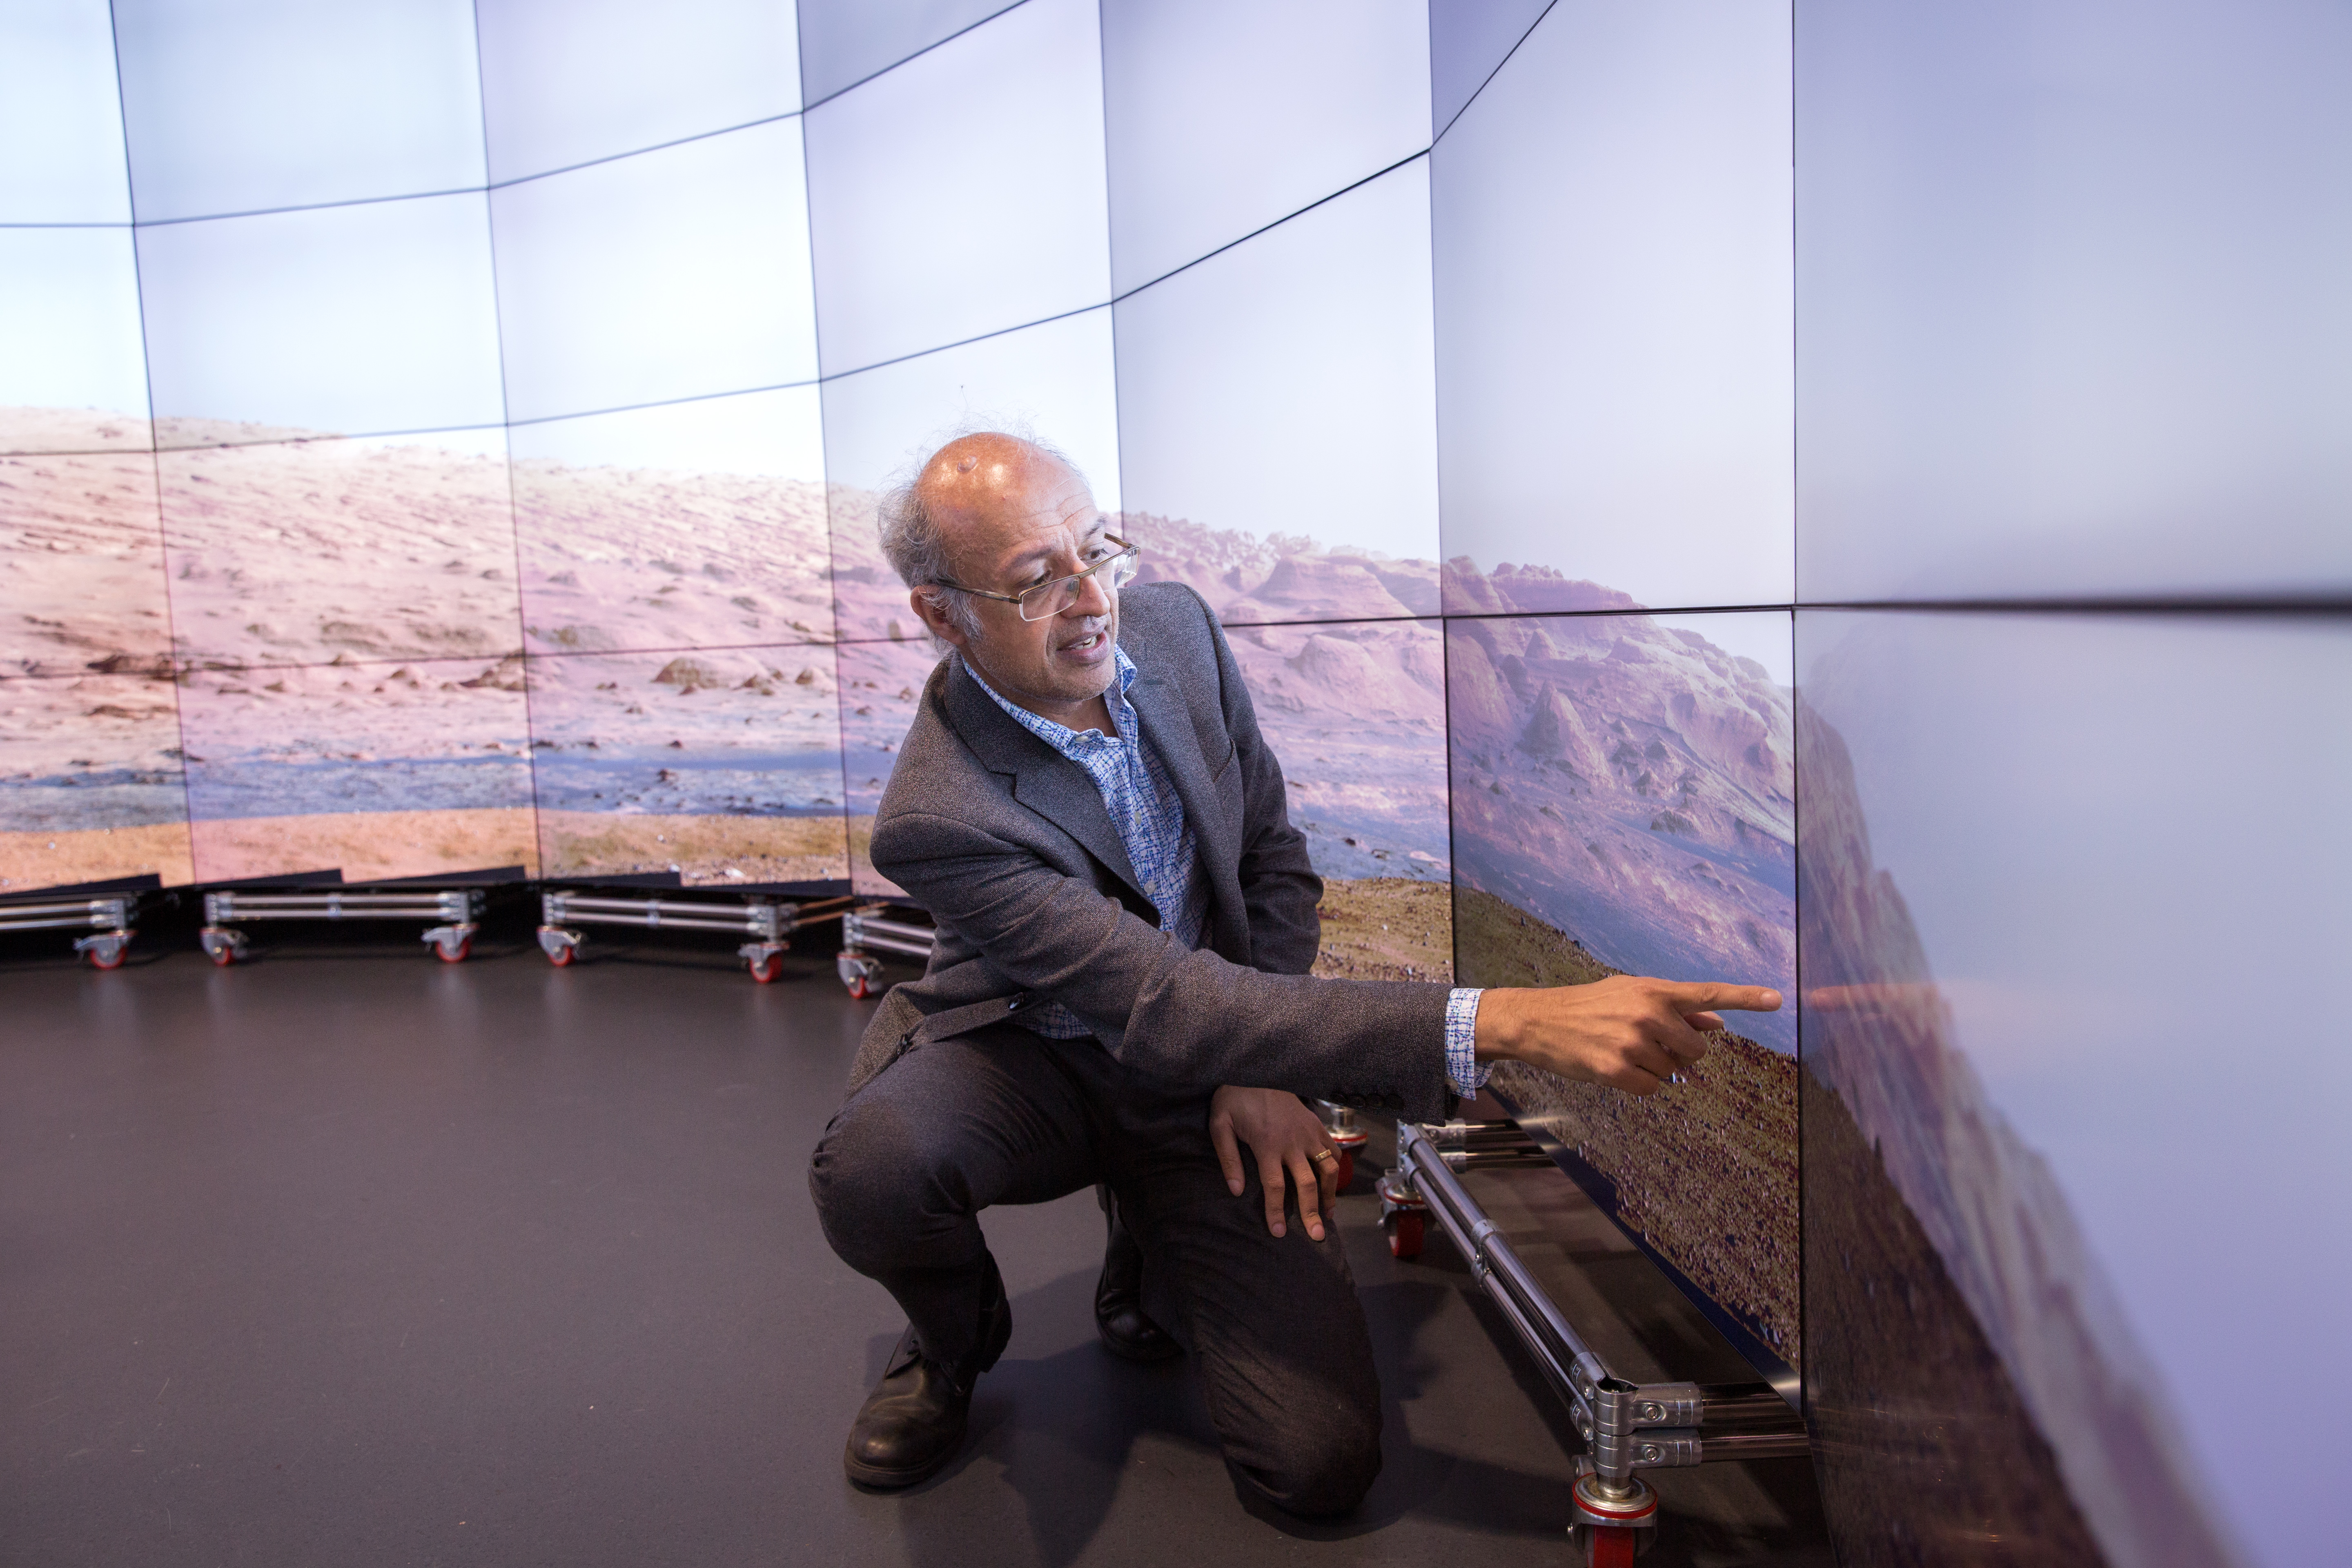
High resolution images of Mars
DSI Fellow Professor Sanjeev Gupta often uses the Data Observatory to examine the geology of the surface of Mars.
Through collaborating with NASA, we are able to show you high resolution images from the Curiosity and Perseverance Rover Missions.
This demo works well for all visitors, from school students through to academic researchers.
Interactive Maps & London Cycling Routes
The Data Observatory environment is particularly interesting for examining and interacting with satellite maps, with the possibility of adding geolocated information on top.
In one example. we can showcase a previous project that worked with TFL to investigate cycling routes in London. The below image is a snapshot of this visualisation, displaying traffic information such as the number of bikes at any given location as well as morning and evening commutes.
This brings maps to life in the DO, getting to see which routes are faster and getting to see the areas we know from a different perspective.

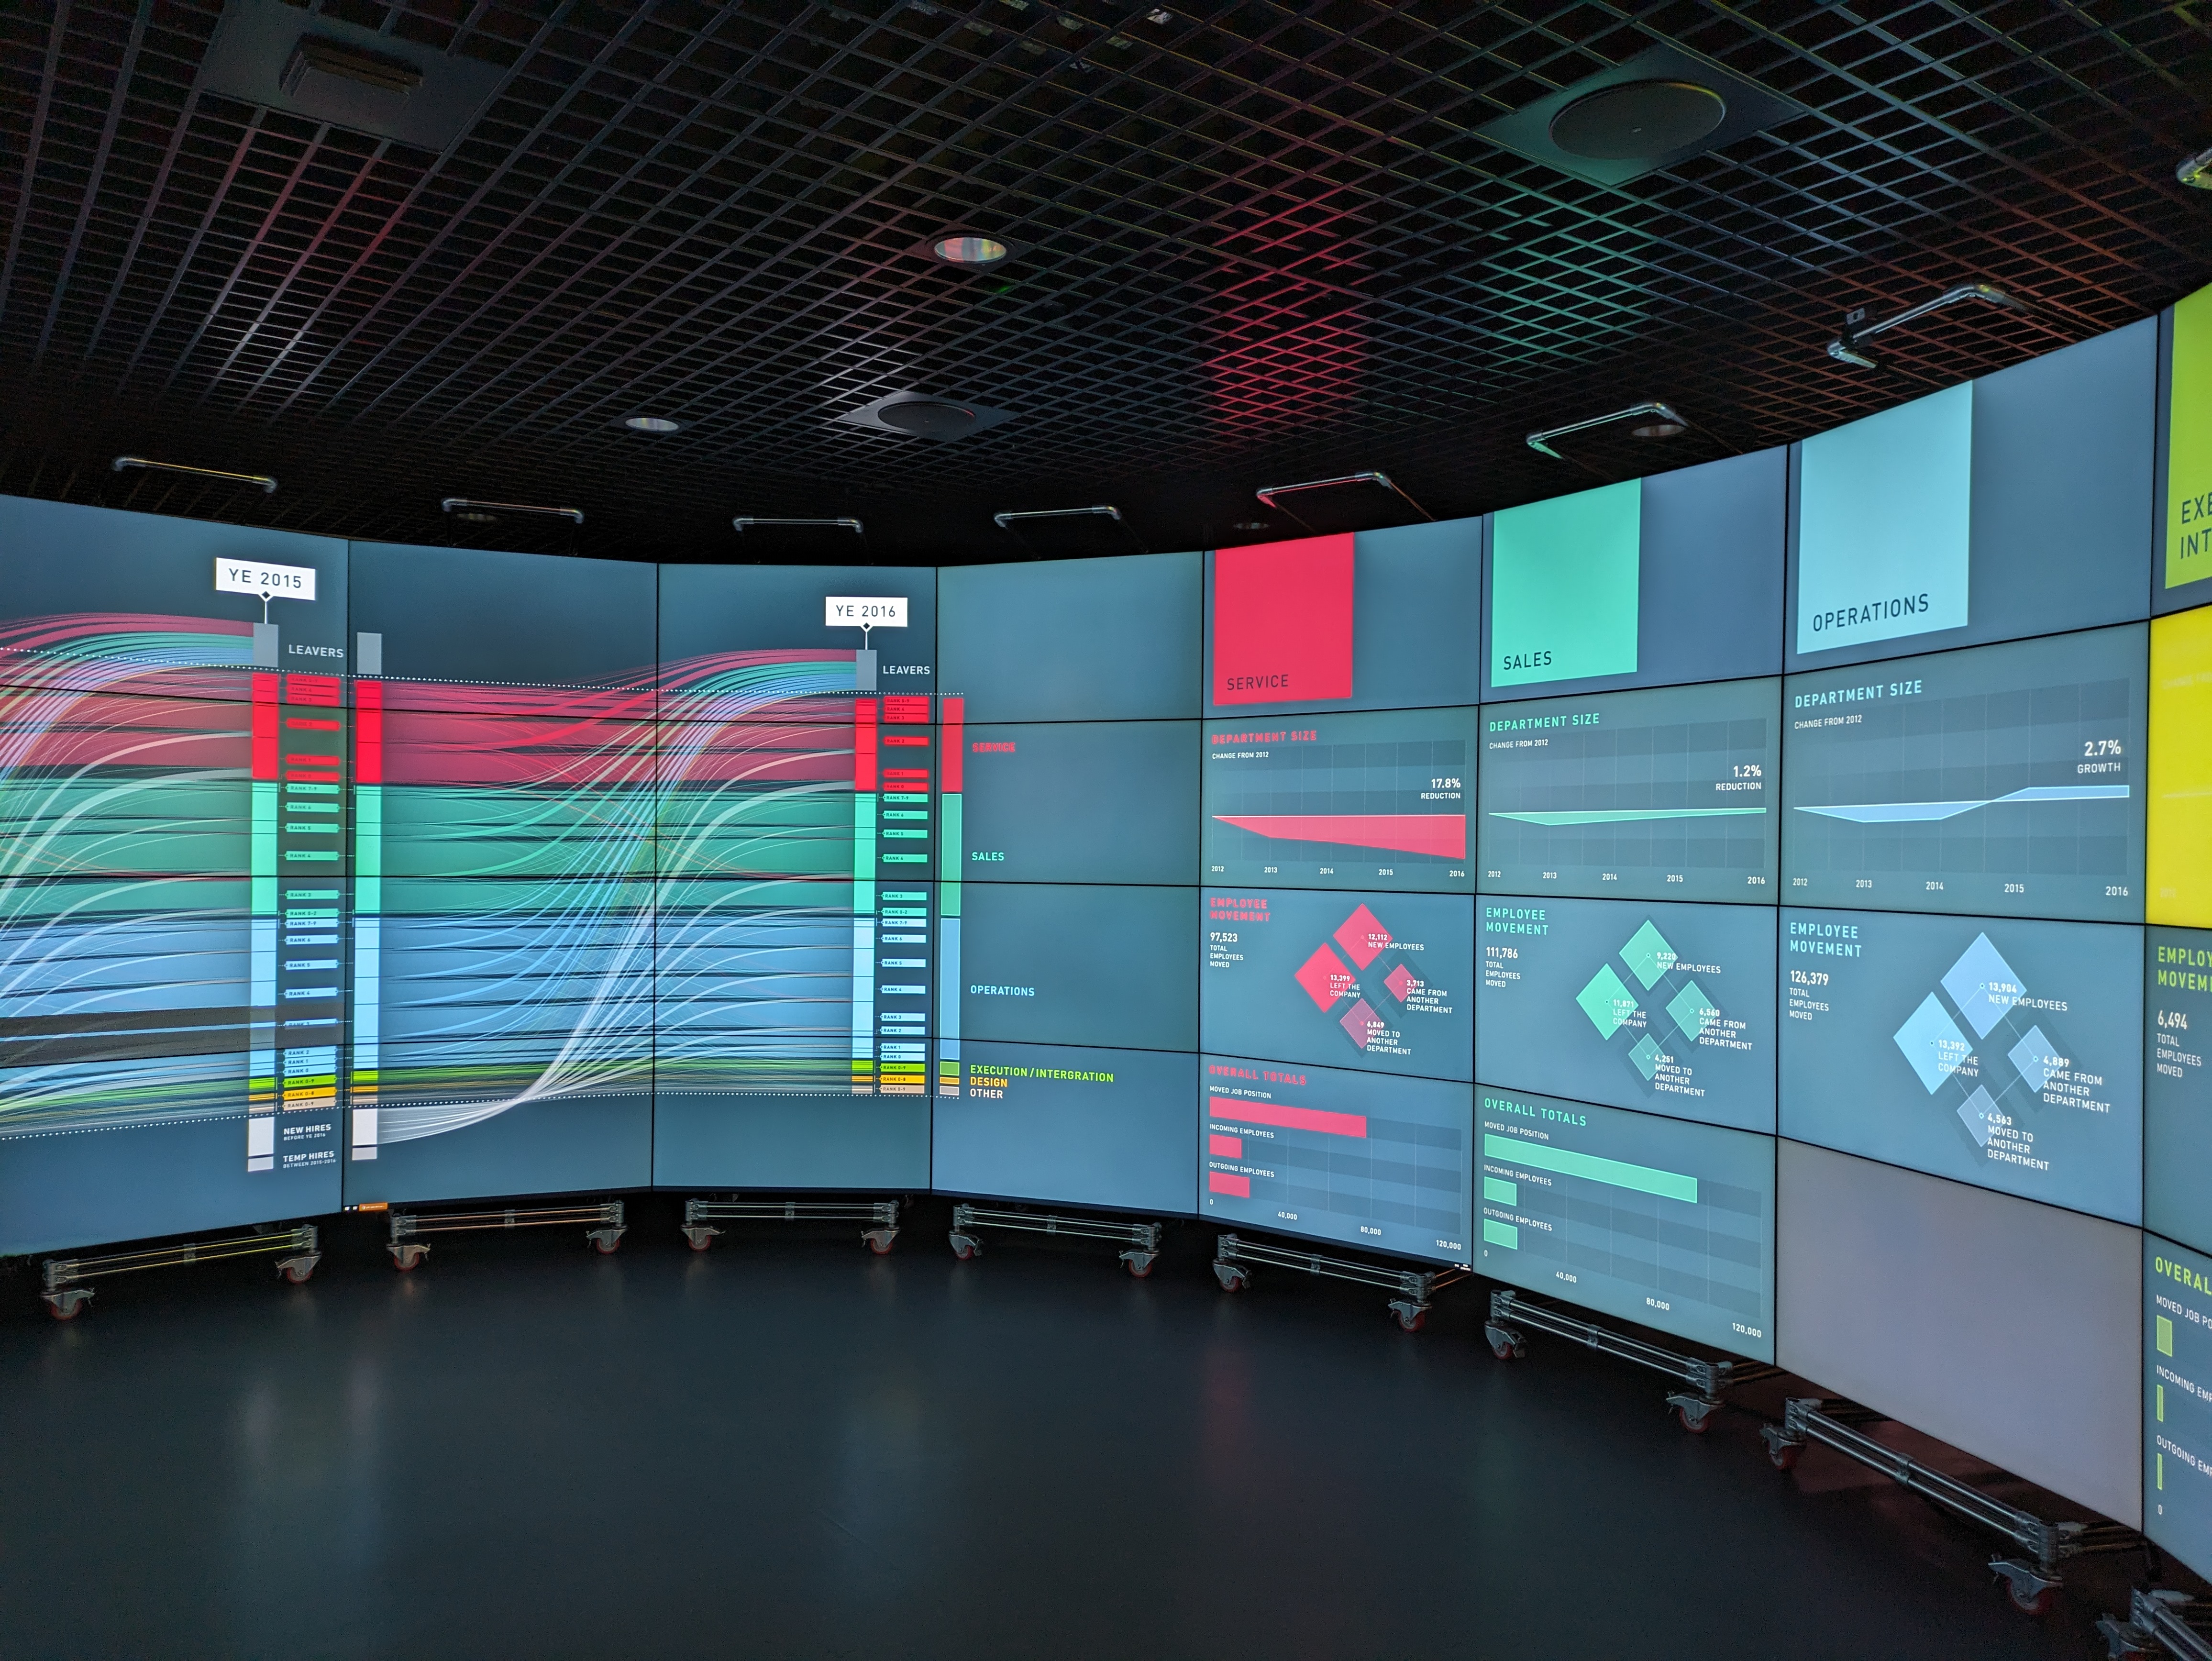
People Flow
Visualisation that shows how employees in a bank moved between different departments within the company through several years. Data comprises biweekly HR record.
Predicting Road Traffic Collision Impact Using Social Media Data
Leverage the untapped potential of social media for road safety with our innovative research project, which utilises Twitter data to predict and visualise the impact of road traffic collisions.
By employing advanced machine learning techniques the system effectively classifies and groups tweets related to specific incidents, offering near-human accuracy in detecting road traffic events.
This approach not only enhances real-time monitoring but also provides an interactive visual platform for stakeholders to engage with and understand the patterns and impacts of road incidents more deeply.
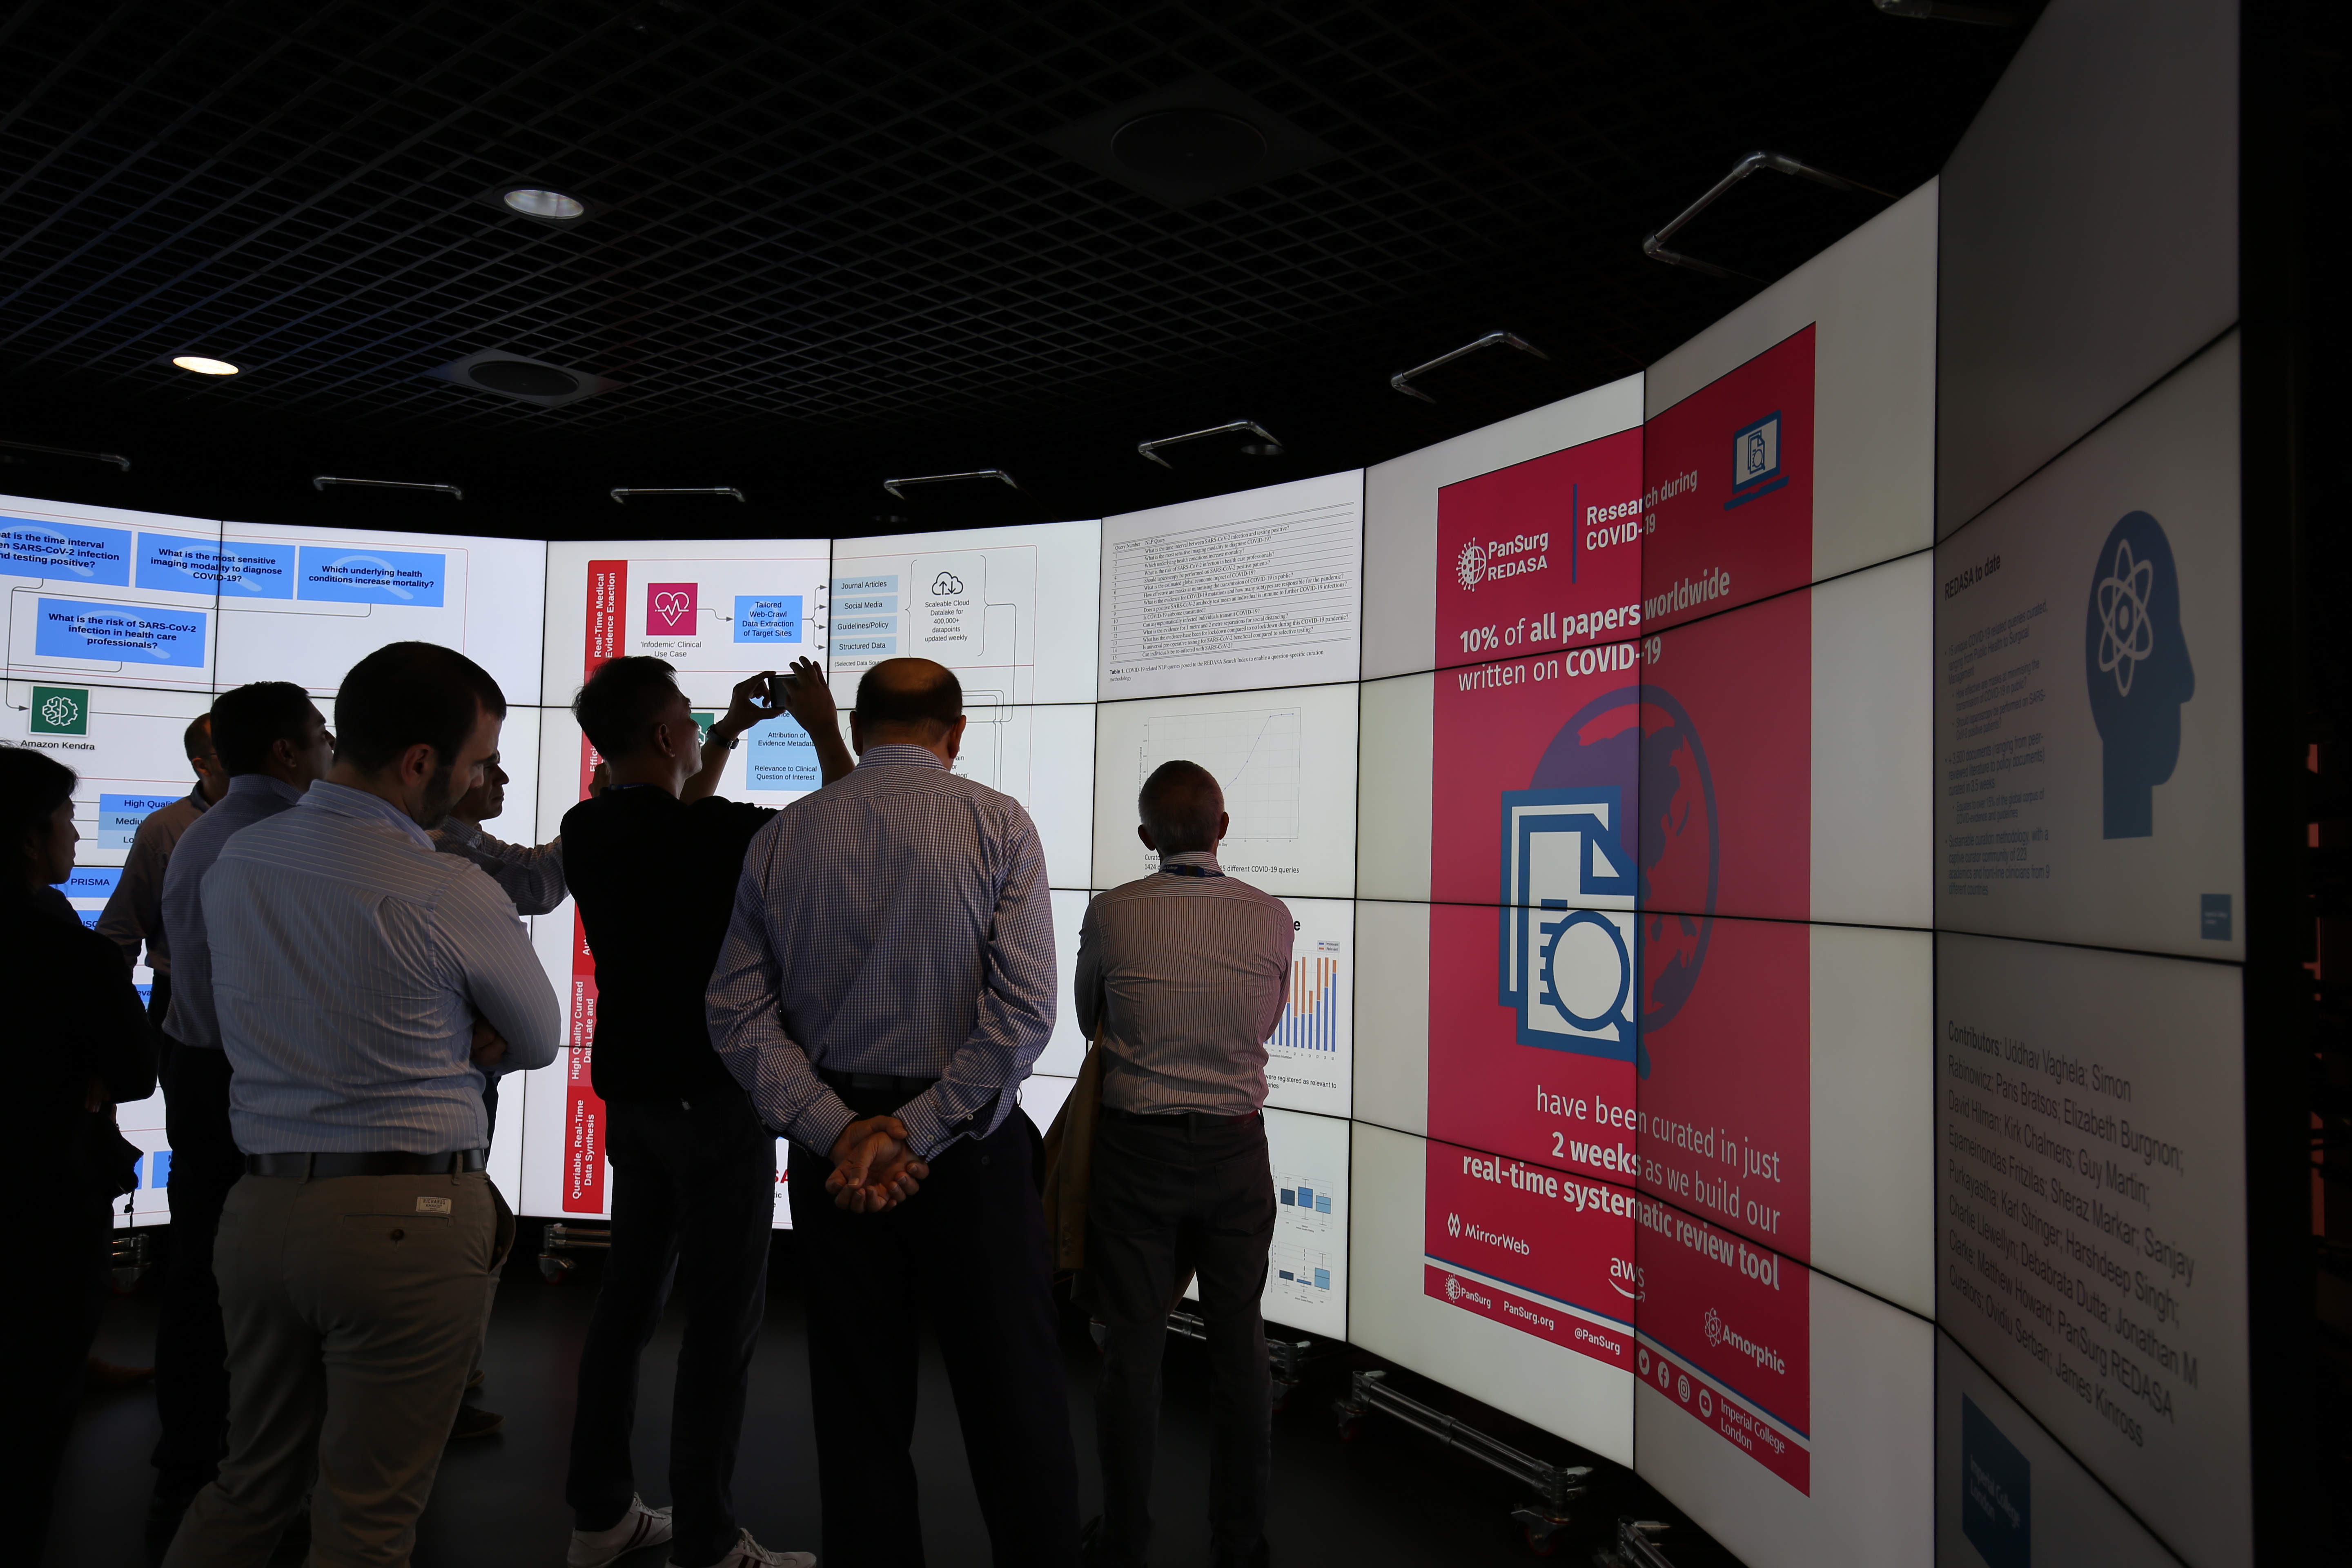
REDASA: Real-Time Literature Analysis Reinvented
Introducing REDASA, a groundbreaking real-time curation platform tailored to streamline the synthesis and analysis of COVID-19 scientific literature.
Developed by the PanSurg Collaborative at Imperial College London, this platform leverages a sophisticated web crawler and human-in-the-loop methodology to provide up-to-date, high-quality medical insights.
With over 104,000 documents curated rapidly into a comprehensive dataset, REDASA is setting the standard for future automated systematic reviews, offering a robust solution to combat the infodemic faced by clinicians and policymakers.
Sharing Economy
Longitudinal study of how Sharing Economy (Uber, Airbnb, etc..) has risen in the last few years in the UK.nIt includes a detailed study on the demographics of the participants, together with a timeline of events leading to it.
.jpg)
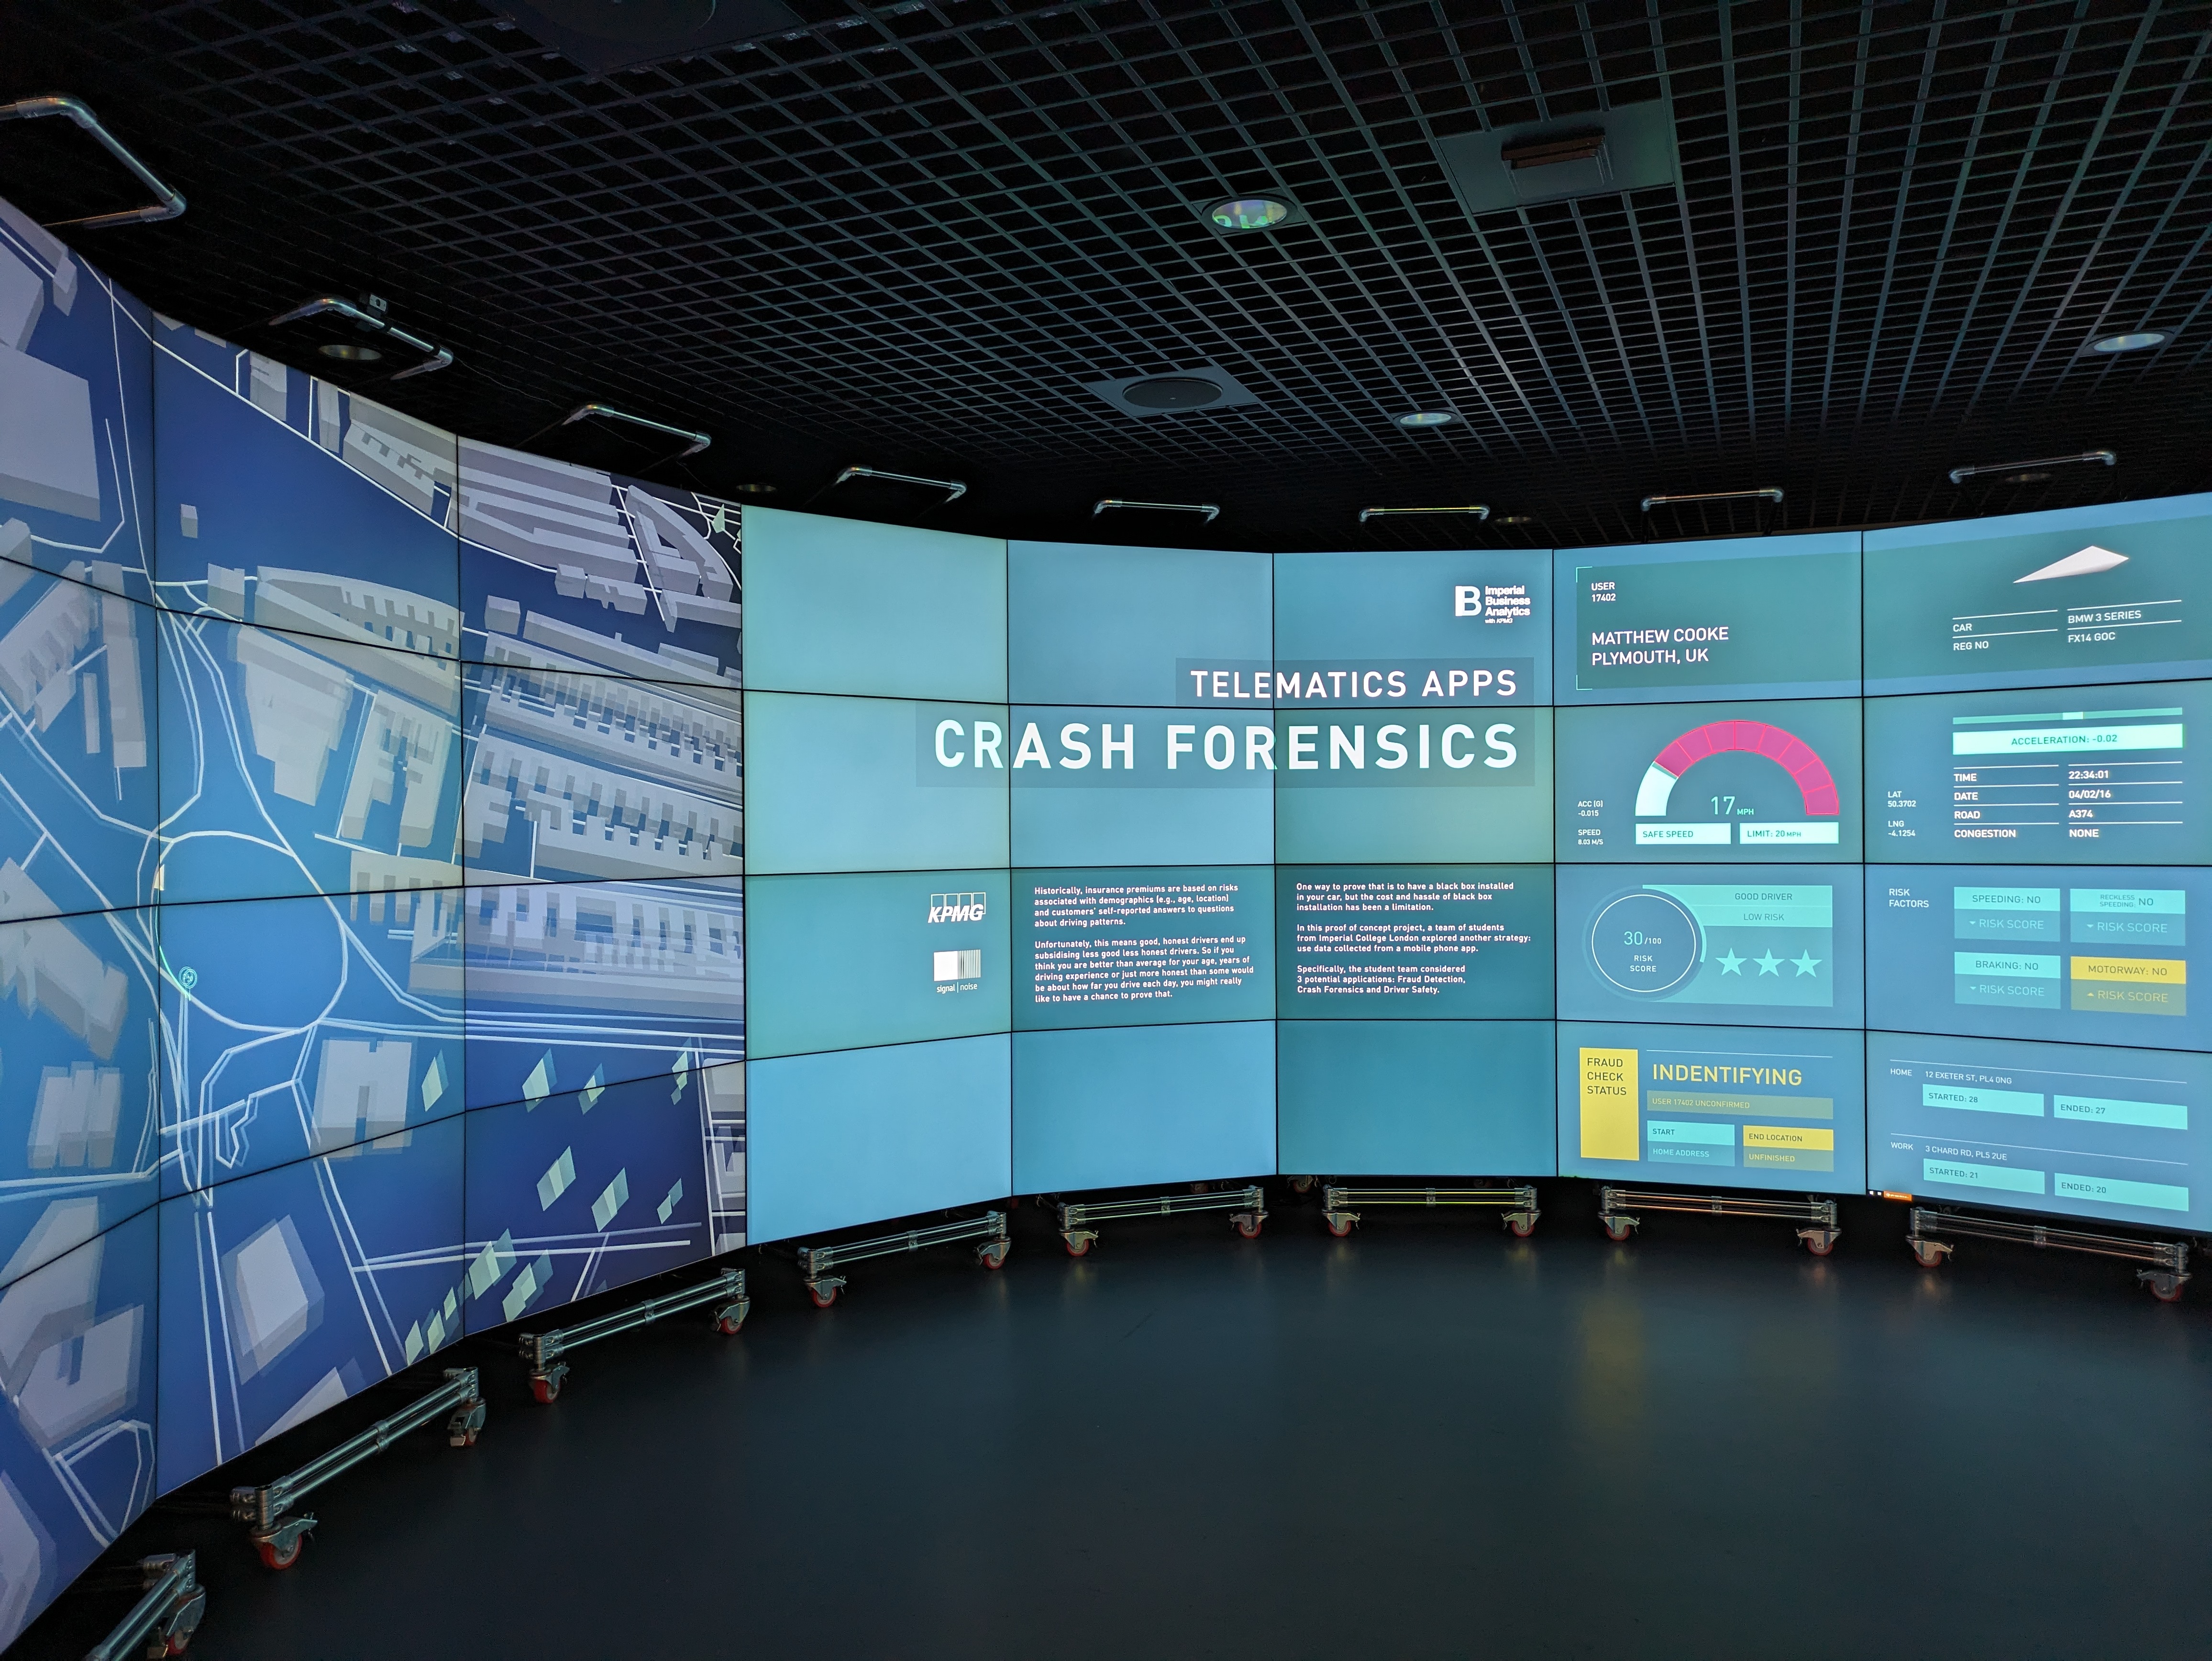
Telematics from Smartphone Data
GPS data in our mobile phones are a great source of information for insurance companies. The aim of the 'Telematics from Smartphone Data' project is to enable car manufacturers, insurers and service providers to deliver an enriched driving experience that creates loyalty and unlocks the value in vehicle. With the help of the DSI, the visualisation presented in the DO shows three user cases of how those data can be used for fraud detection, crash forensic, risk assesment and more.
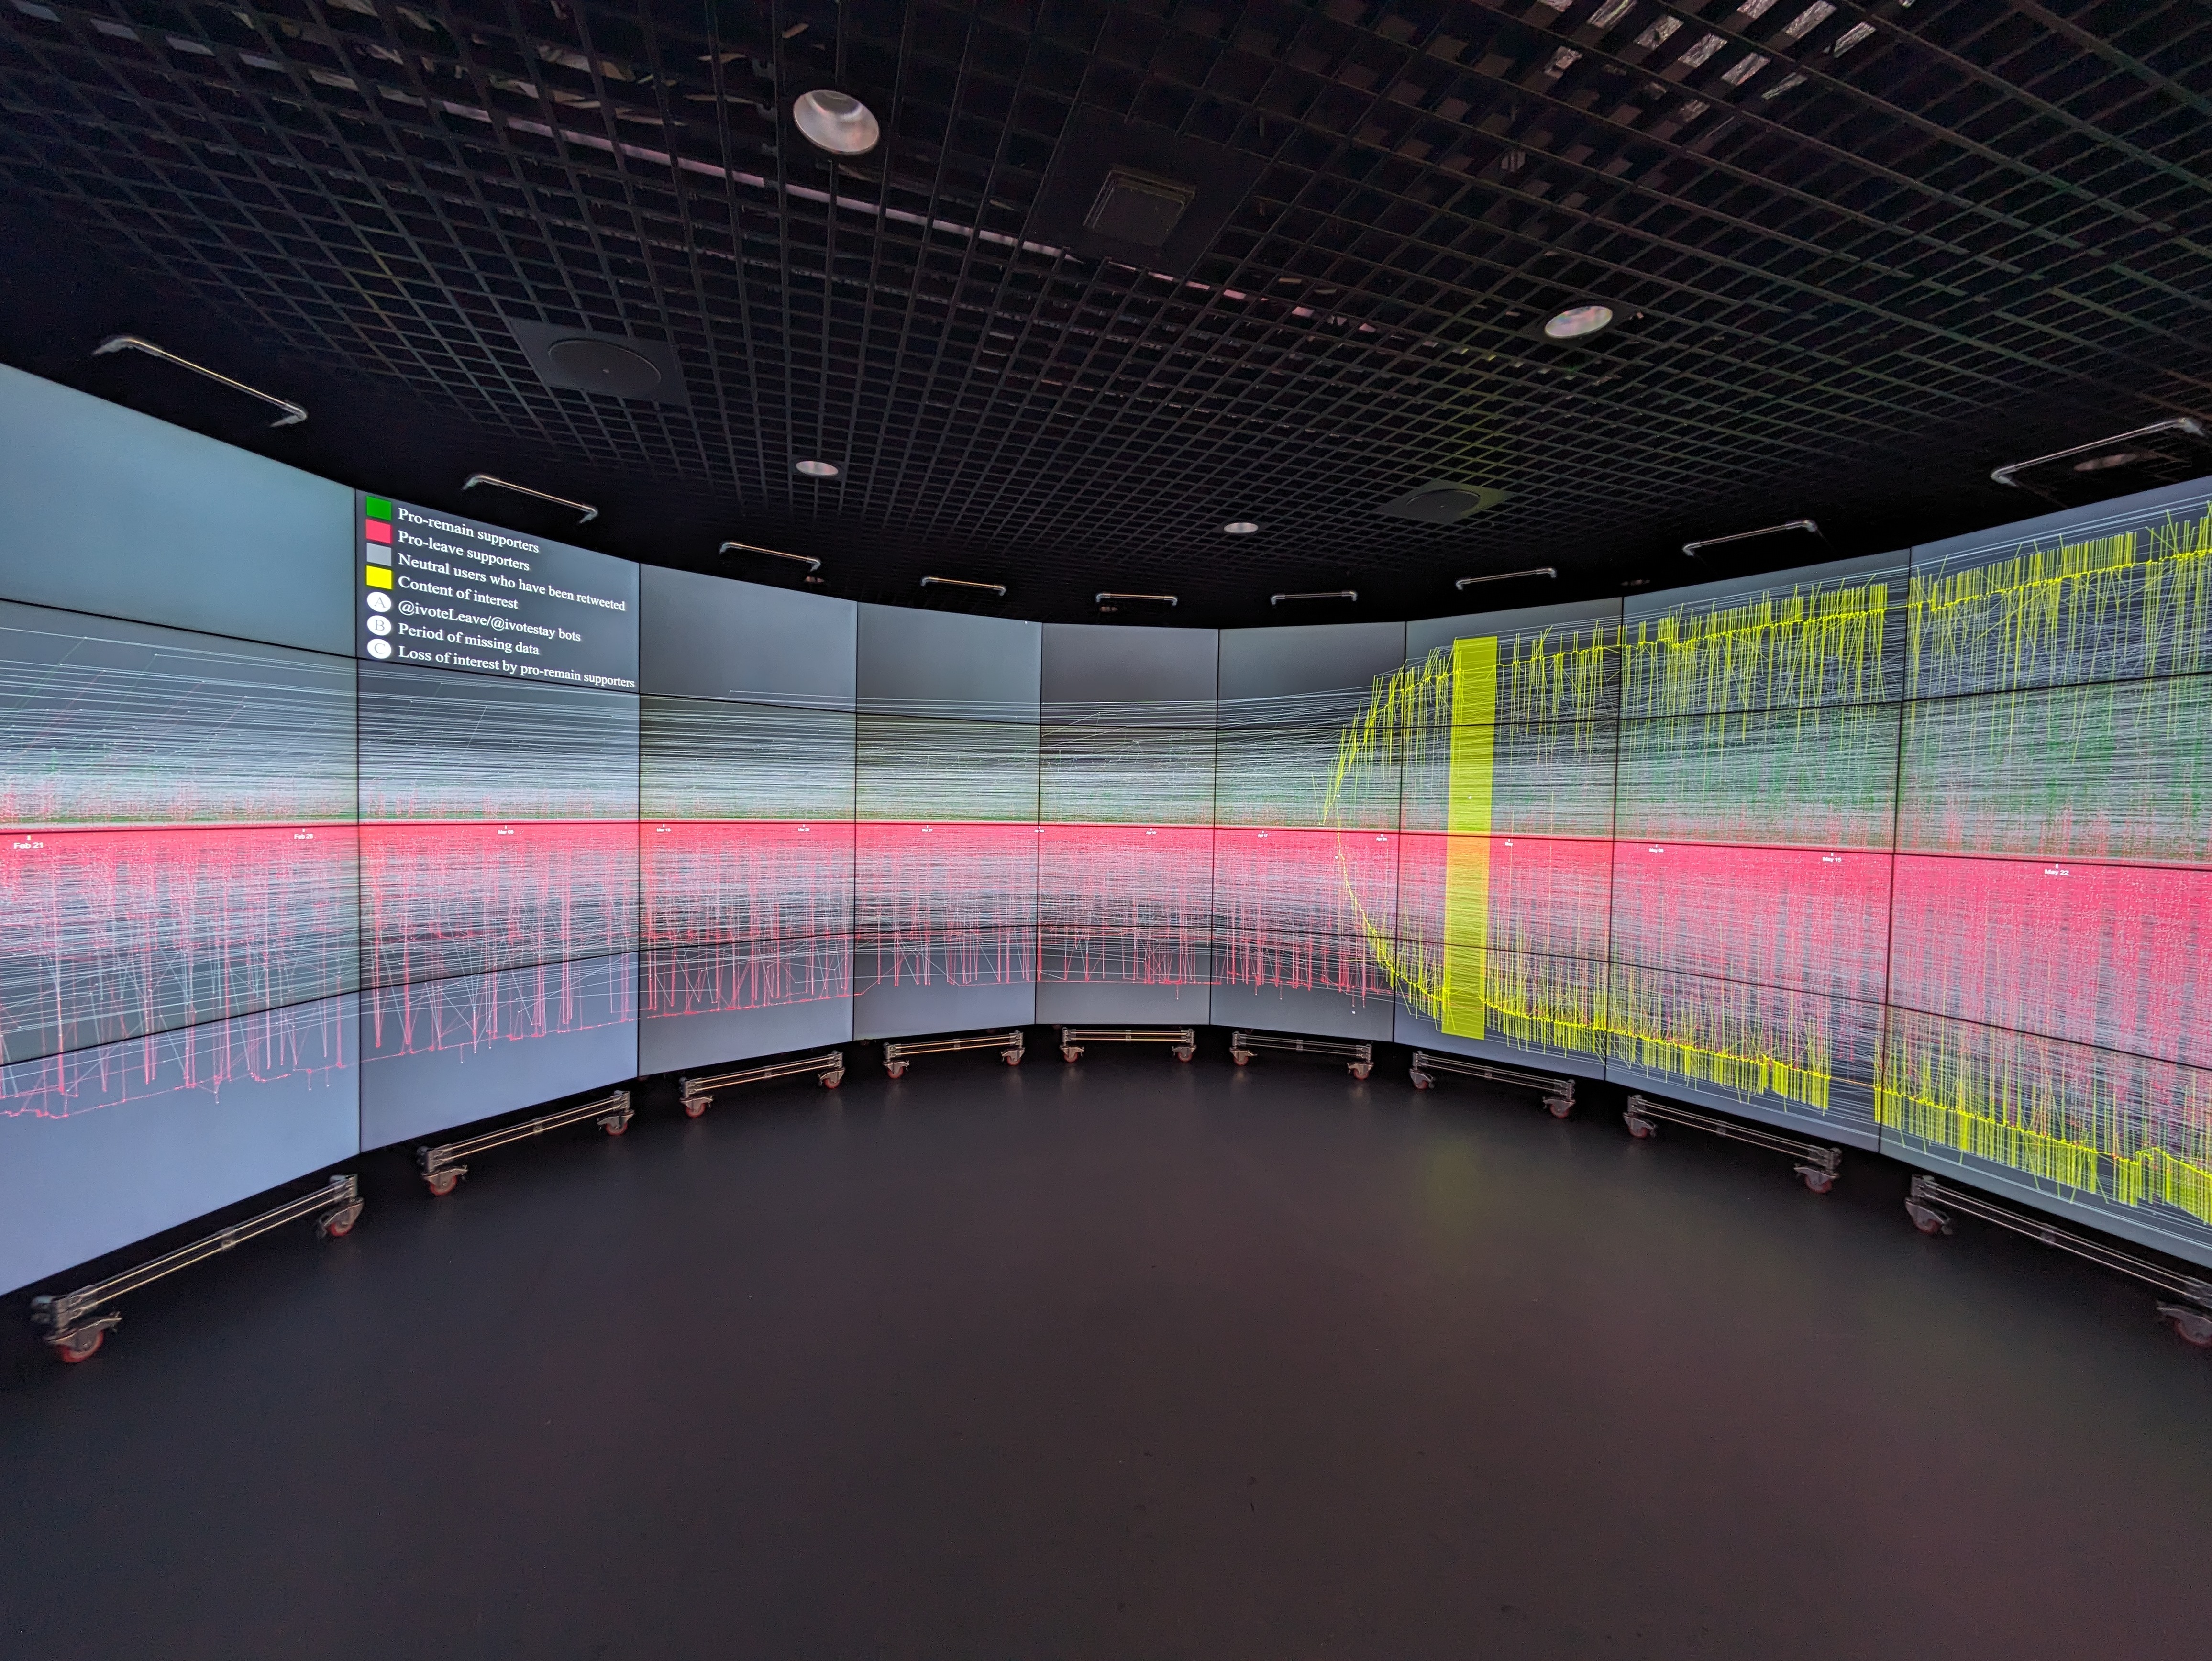
Towards a large-scale Twitter Observatory for political events
Discover the future of political analysis with our Large-Scale Twitter Observatory, a revolutionary tool designed to manage and visualize massive datasets from social media for actionable insights.
This cutting-edge solution empowers researchers to efficiently retrieve, analyze, and display Twitter data, facilitating a deeper understanding of political events.
Using social media users as sensors in healthcare applications
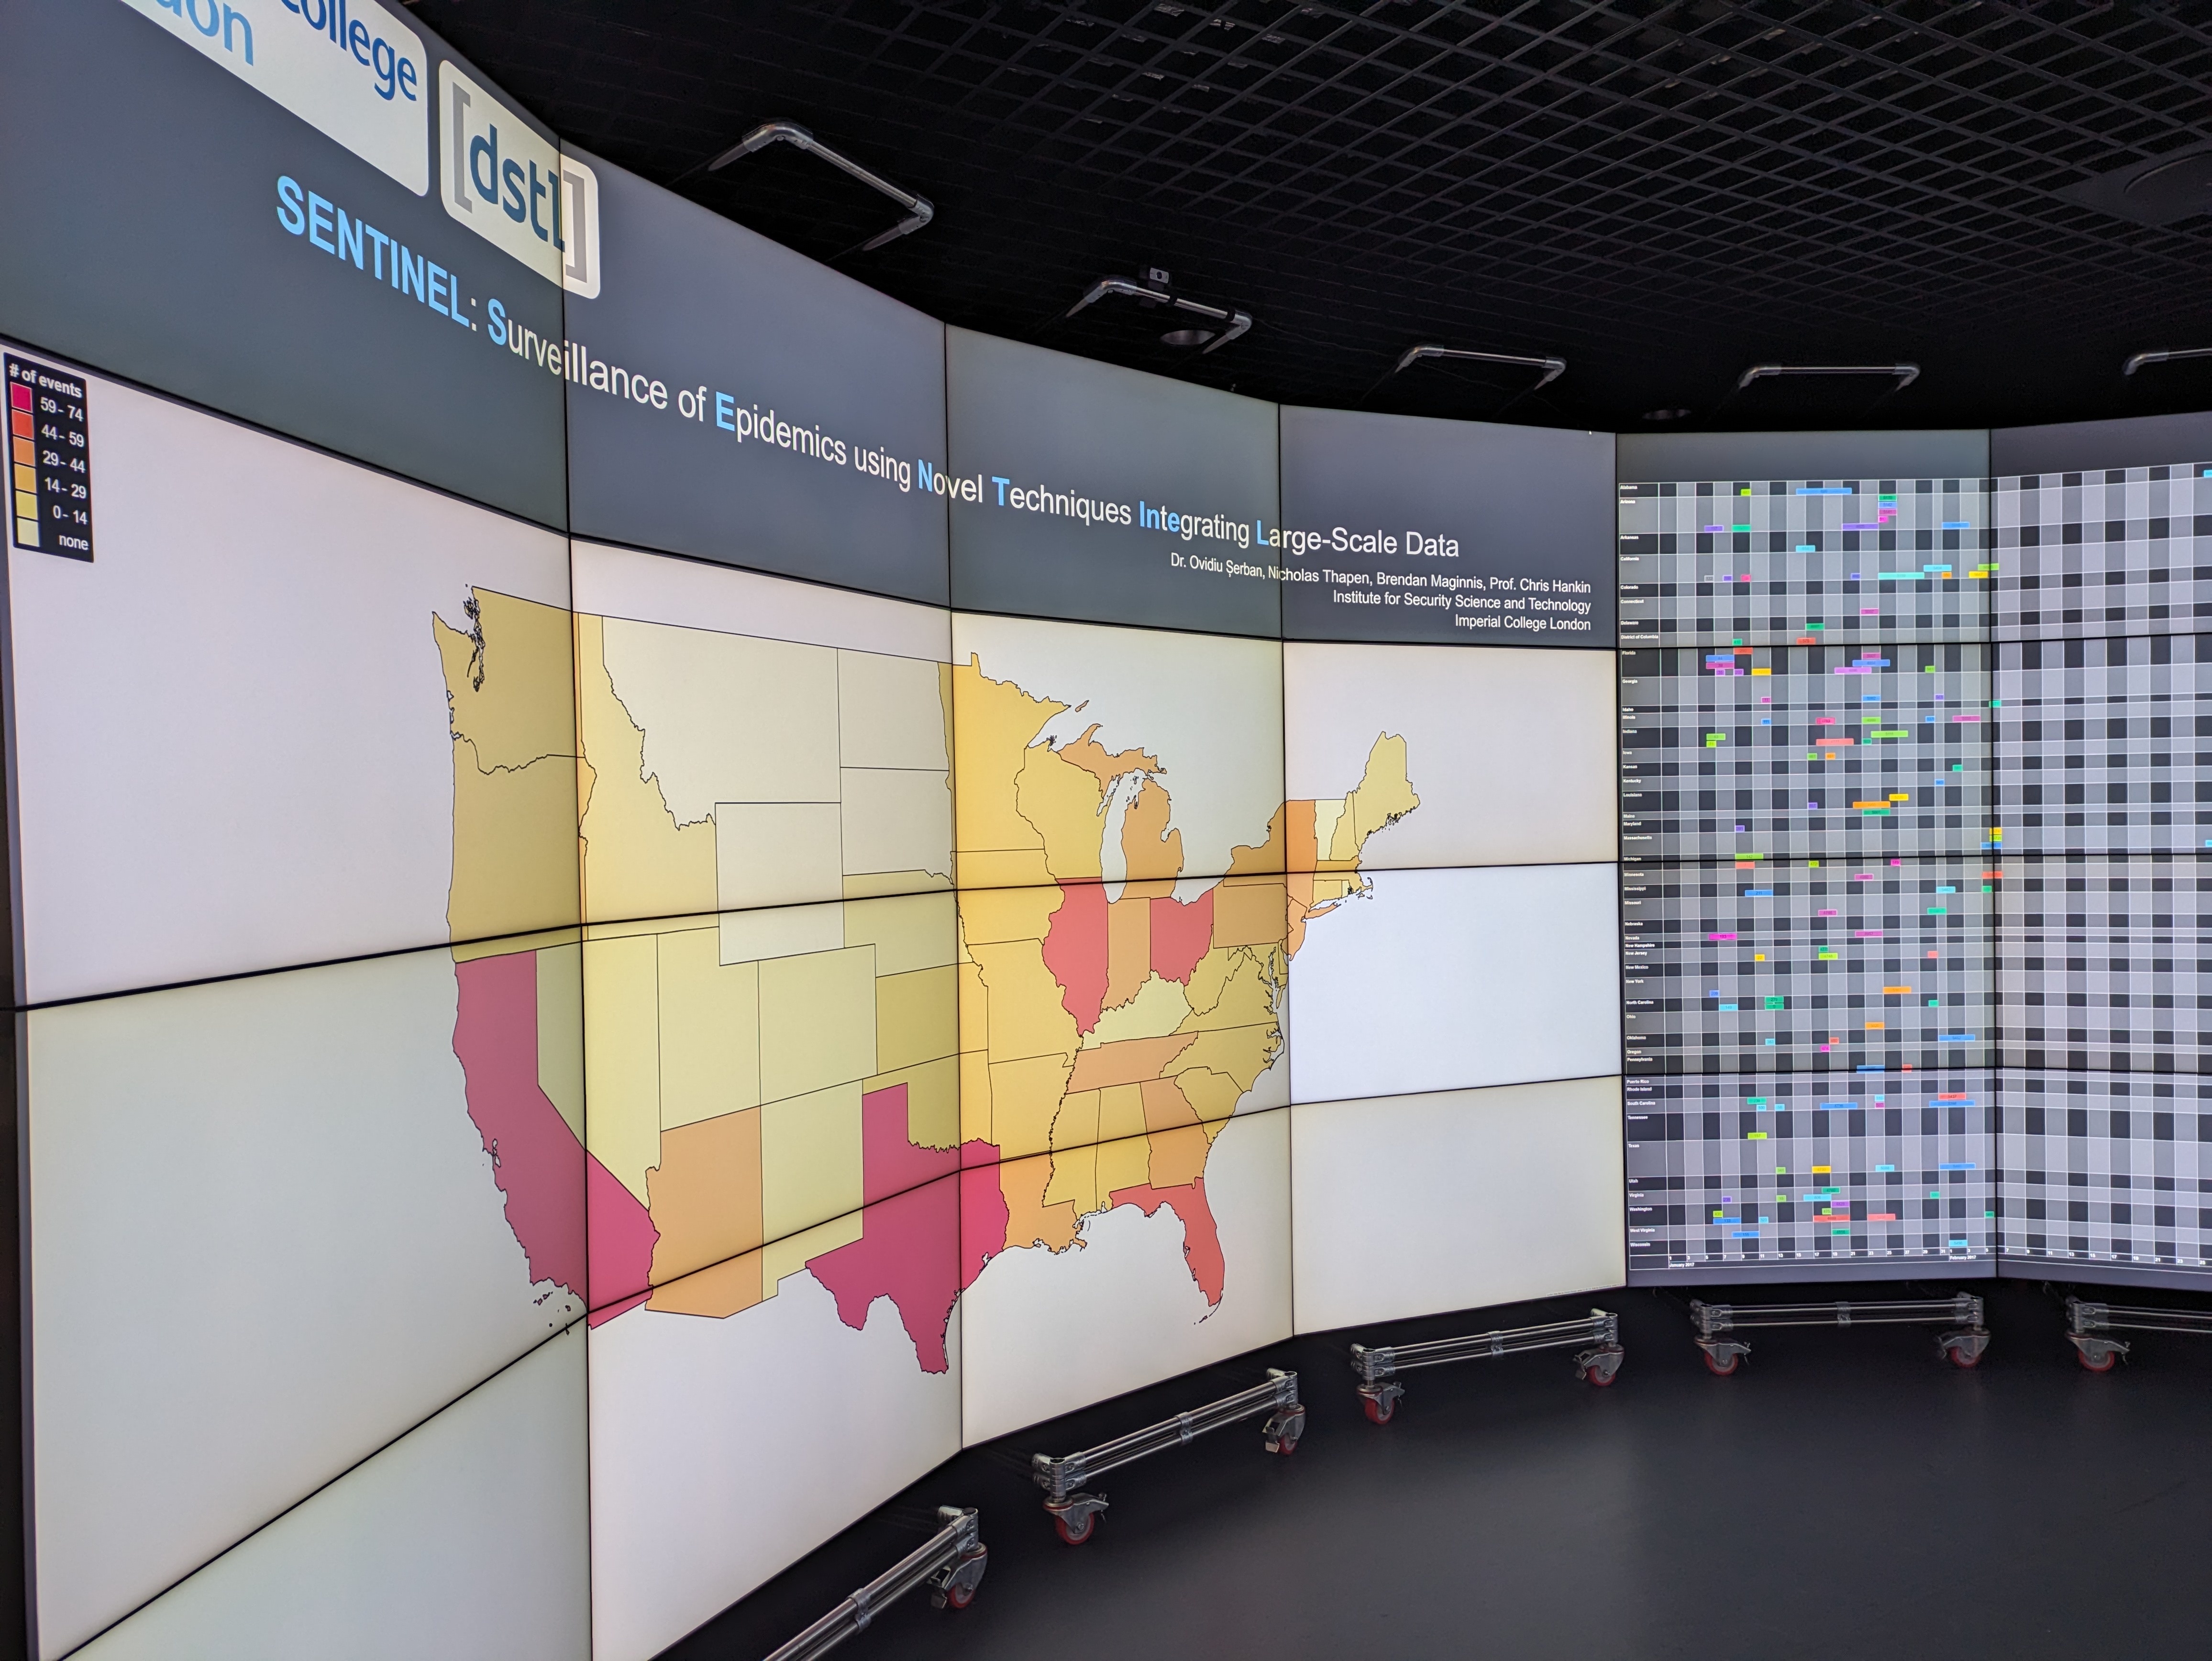
SENTINAL: Surveillance of Epidemics using Novel Techniques Integrating Large-Scale Data
Discover the future of public health monitoring with our state-of-the-art software system, designed to harness the power of social media for real-time disease surveillance.
Utilizing the latest advancements in machine learning and data processing, the system excels at identifying potential disease outbreaks by analyzing health-related tweets with remarkable accuracy.
This innovative approach not only provides faster outbreak detection compared to traditional methods but also incorporates nowcasting features that enhance disease predictions using a combination of social media and clinical data.
With proven effectiveness in detecting and monitoring influenza-like symptoms, our technology is an essential tool for public health officials seeking to improve response strategies and situational awareness.
Student projects
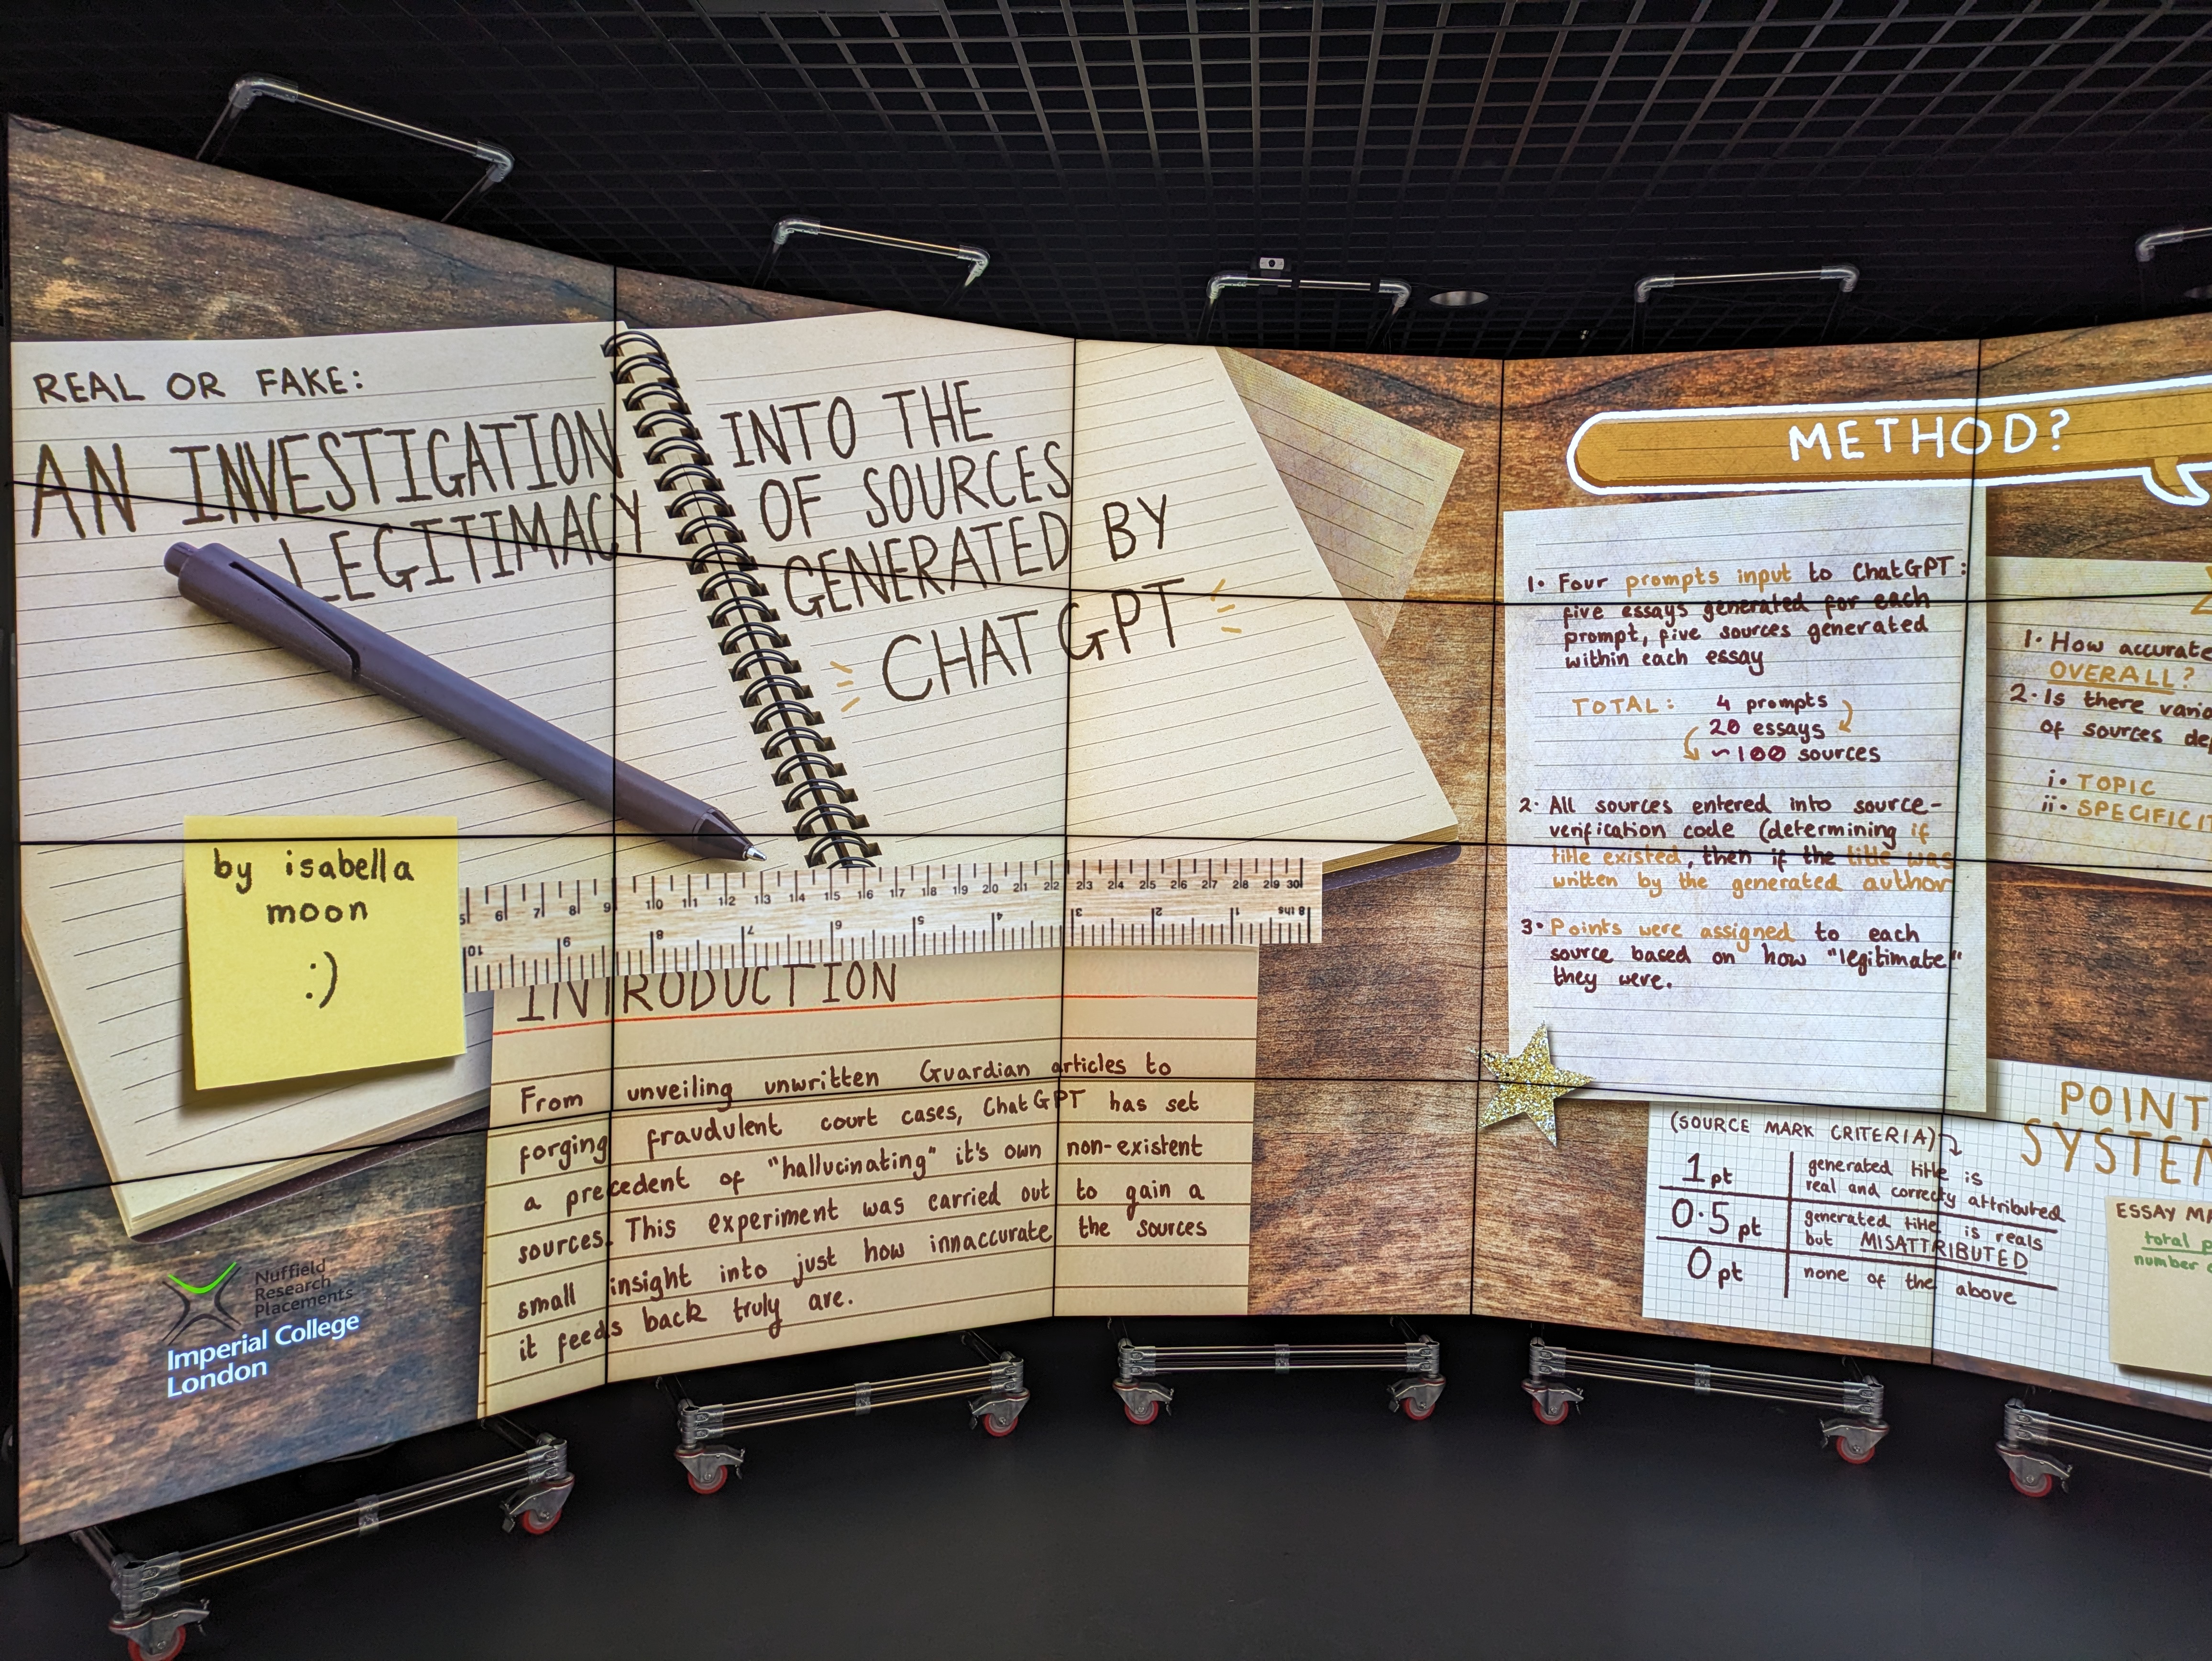
'Marking ChatGPT's Homework': An investigation into the legitimacy of sources generated by ChatGPT
ChatGPT has set a precedent of ‘hallucinating’ its own non-existent sources.
This demonstration was developed as part of a student placement to investigate how inaccurate ChatGPT-generated sources actually are.
This demo works well for a range of visitors, from school students to academics, policymakers or practitioners wanting to know more about the opportunities and challenges of generative AI.
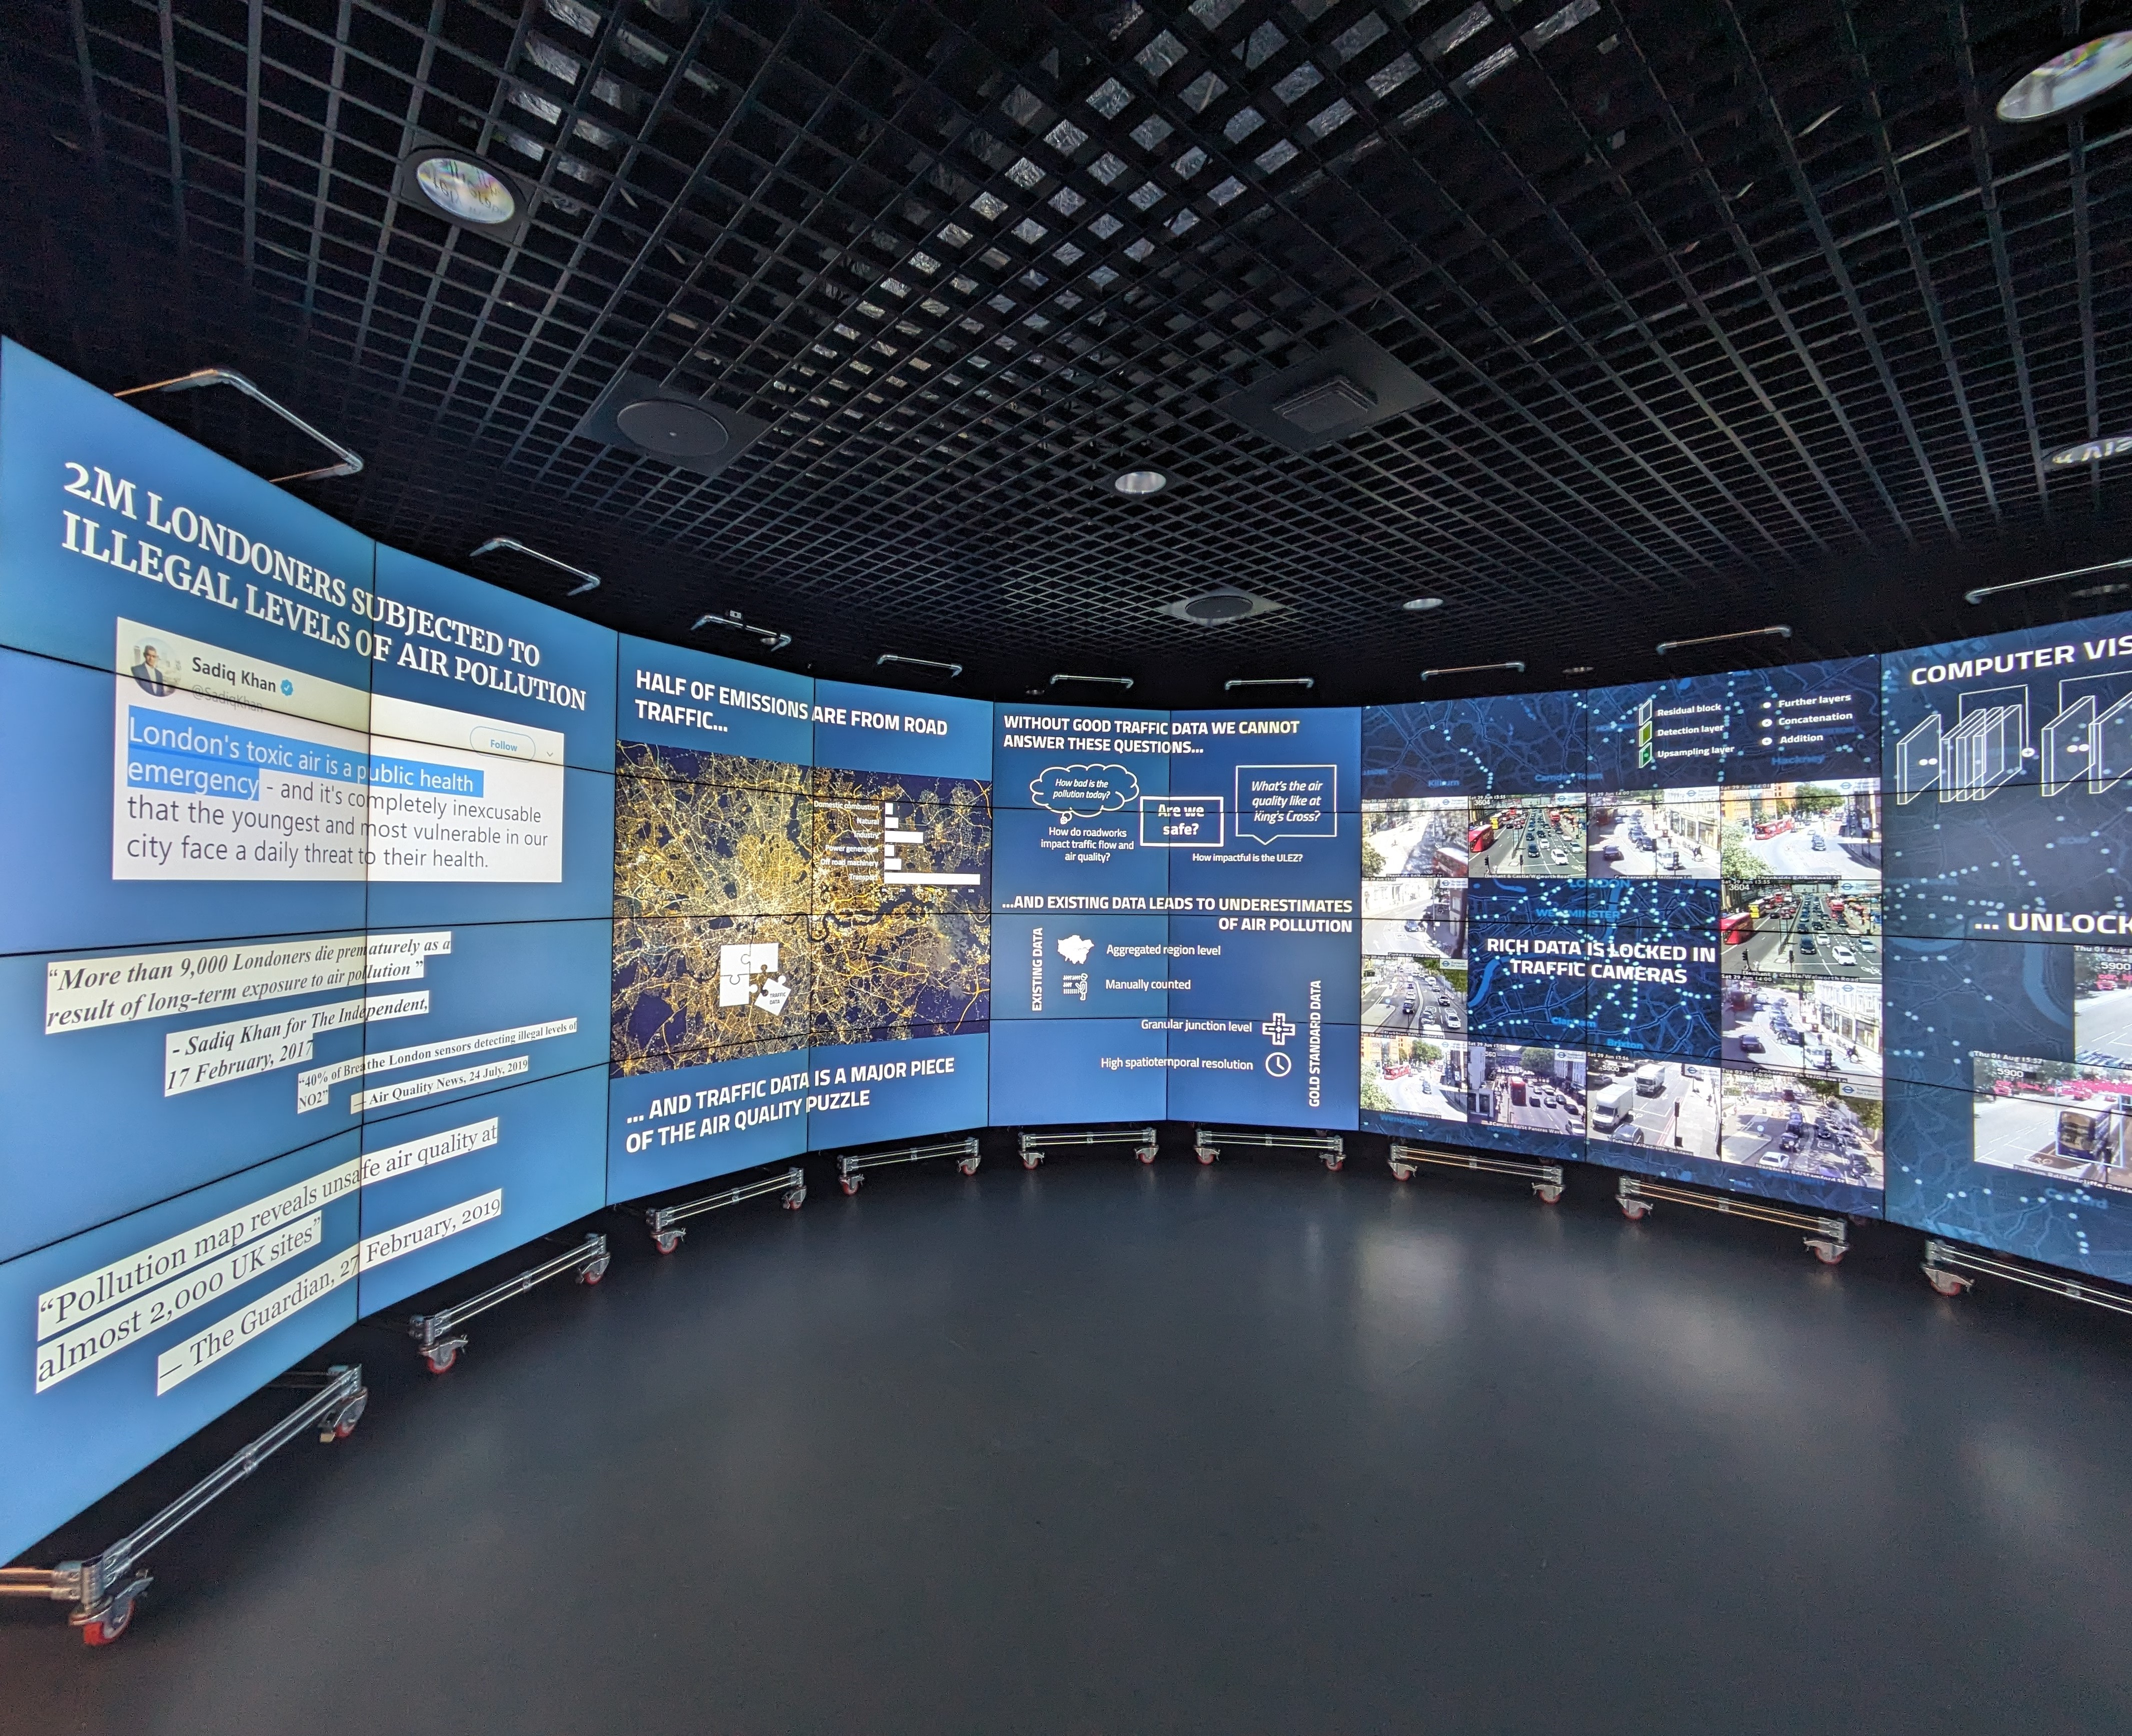
Quantifying traffic dynamics to monitor air pollution in London
More than 2 million Londoners are subjected to illegal levels of air pollution every day (2019). One way that researchers are helping to address this problem is by improving air quality models to make better estimates of what air quality is within London. These models require good traffic data because traffic represents a key contributor to air pollution in London.
In a project by the DSSG London Air Quality team at the Gandhi Centre for Inclusive Innovation at Imperial Business School, students used TFL data and computer vision to track vehicles in traffic cameras. This project aims to provide more accurate information about traffic congestion through the city, so that air pollution levels can be better estimated.
The team behind this project created an algorithm that counts the number and type of moving vehicles travelling in London by analysing images from jam camera videos. The data collected by the algorithm provides a more accurate record of the number of moving vehicles and the number of times each vehicle stops and starts. This creates a more accurate picture of the level of moving traffic and associated air pollution levels across the city.
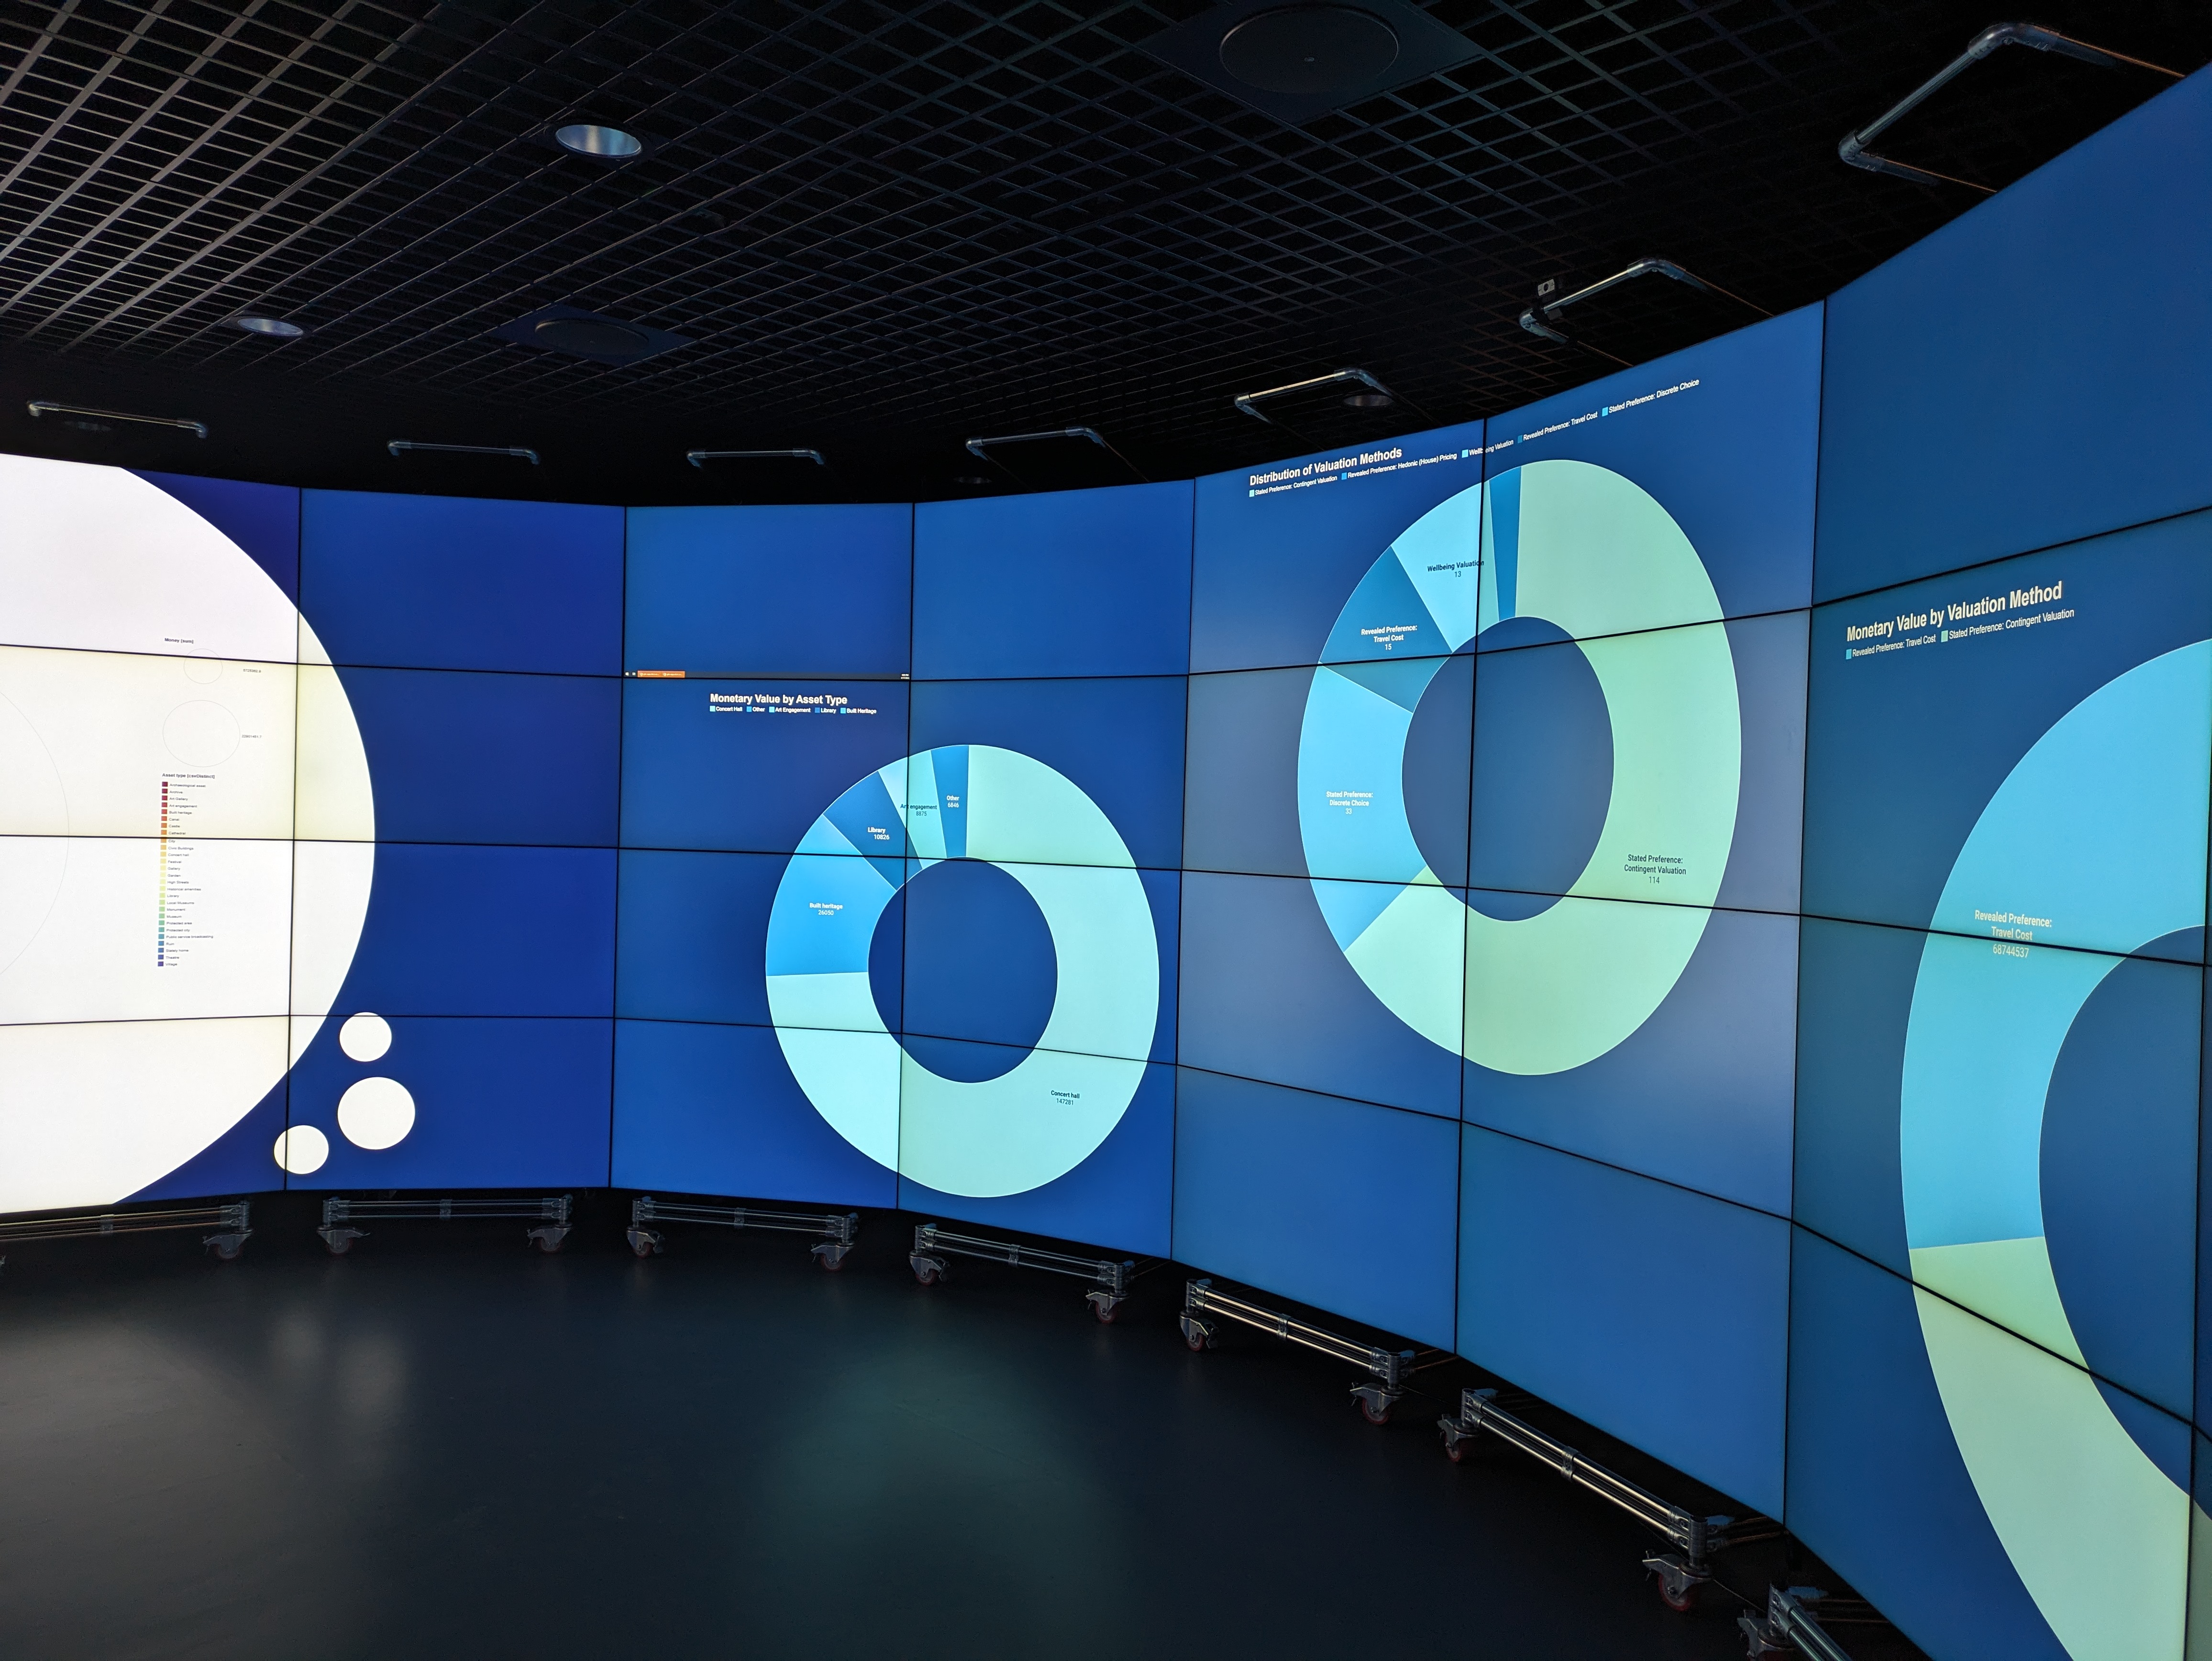
Valuing our Cultural Heritage
This demo was created as part of a novel interdisciplinary student project with undergraduate students from the History of Science, Technology & Industry course taught by DSI Fellow Dr Weatherburn.
During the project the students used the evidence bank from a study by the UK Department for Digital, Culture, Media & Sport (DCMS) entitled Rapid Evidence Assessment: Culture and Heritage Valuation Studies which has now grown into this larger UK Research and Innovation (UKRI) study.
Students worked in five interdisciplinary groups in short periods across two months, following Dr Weatherburn’s research project hackathon approach. They then presented the work in the data observatory on 22nd February 2024.
The experience highlighted how successfully CLCC and DSI staff can collaborate as well as demonstrating that, even within a limited timeframe, Imperial undergraduates can produce considerable results with no specialist training.