The Space and Atmospheric Physics Group routinely receives processes and stores large amounts of satellite data in order to address a number of important research topics aimed at better understanding the Earth's climate system. An area of particular current interest concerns the detection and quantification of aerosol and its impact on the Earth's radiation budget, or the amount of energy entering and leaving the Earth's atmosphere. Researchers within the group make use of observations from the Geostationary Earth Radiation Budget (GERB) instrument, a project for which Imperial College is the scientific lead, and the Spinning Enhanced Visible and InfraRed Imager (SEVIRI) both in geostationary orbit on the Meteosat Second Generation series of satellites situated over the equator and Greenwich Meridian. The geostationary orbit means that the instruments can effectively be used to track specific events that occur within their field of view with very high time resolution. The figure above shows an example of the type of information contained within the SEVIRI observations. Here, observations from three different SEVIRI thermal infrared channels have been combined and colour-coded in such a way as to emphasize aerosol events. Thus, volcanic emissions that originated from the Puyehue eruption in Chile on 4th June 2011 and have spread around the southern hemisphere show up as yellow, while a dust storm developing in Sudan on the border with the Red Sea is deep magenta. The imagery also permits the identification of deep cloud systems (red) and can be used to highlight the temporal evolution of land surface temperature (contrast the colder, pinker colours over the Sahara at night in the left-hand image with the bluer colour seen during the day, indicative of higher temperatures, in the right-hand image).
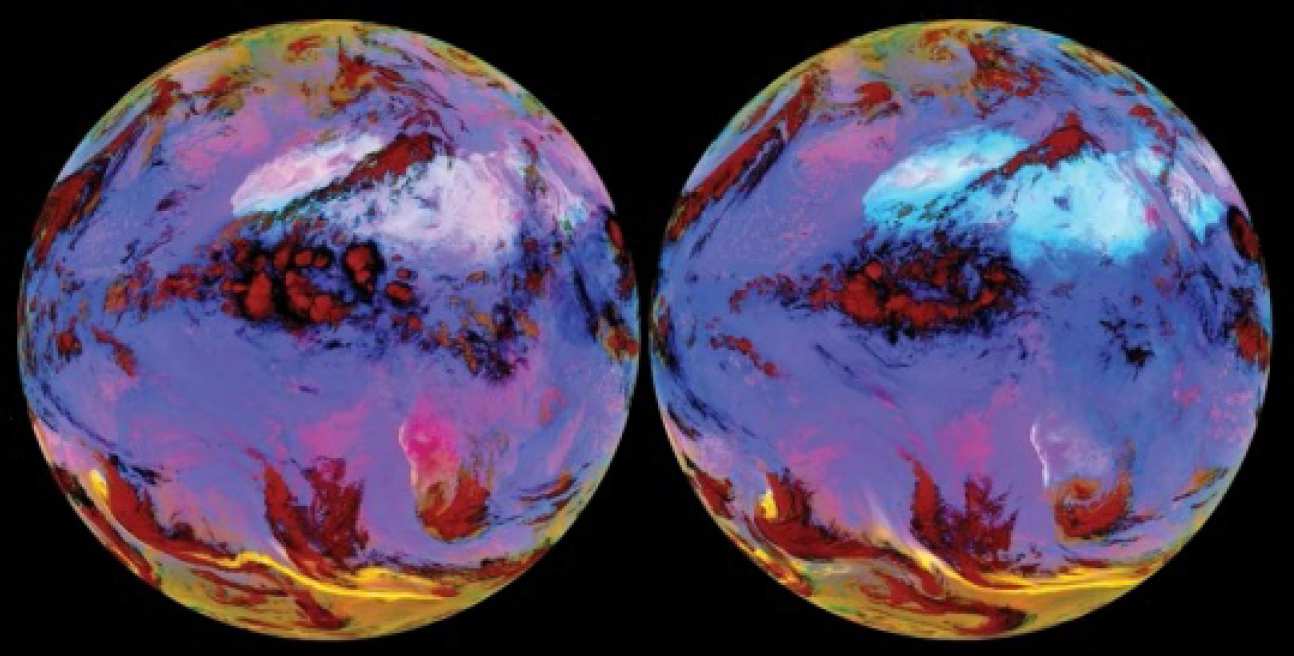
Imagery from SEVIRI on Meteosat-8 at midnight (left) and 12 pm (right) on 8th June 2011 viewing Europe, Africa, Arabia and the Atlantic. Deep red colours indicate cloud systems, the area of deep magenta over Sudan is a developing Saharan dust storm, while the yellow streaks are volcanic ash transported over the South Atlantic from the eruption of the Puyehue volcano in Chile (Source: Raw data from EUMETSAT, Dr Helen Brindley’s own imagery).
Data such as these have been used in near-real time to provide support for several scientific field campaigns in Africa as well as providing the first observationally based quantification of the degree to which aerosol can act to both heat and cool the Earth-atmosphere system locally, dependent on time of day. The challenge now is to extend these findings to cover a larger area over a longer time period, requiring the provision of dedicated data storage, suitable back-up facilities and processing capability.