To ensure student-driven innovation as part of the Assessment Data Analytics project, the team launched a Student Shapers Project in Autumn 2024. Two Student Shapers (Shama L. Sasikumar and Vivan Vasudeva), from the Life Sciences and Mathematics departments, partnered with the Project Team in Autumn 2024. They supported the project for a total of 16 weeks, during which they developed two student-facing prototypes. These prototypes were evaluated in user-testing interviews and focus group sessions, conducted by the Student Shapers, in which their peers provided feedback. This evaluation process was critical for the project as it provided invaluable student insight.
The Student Shaper Journey
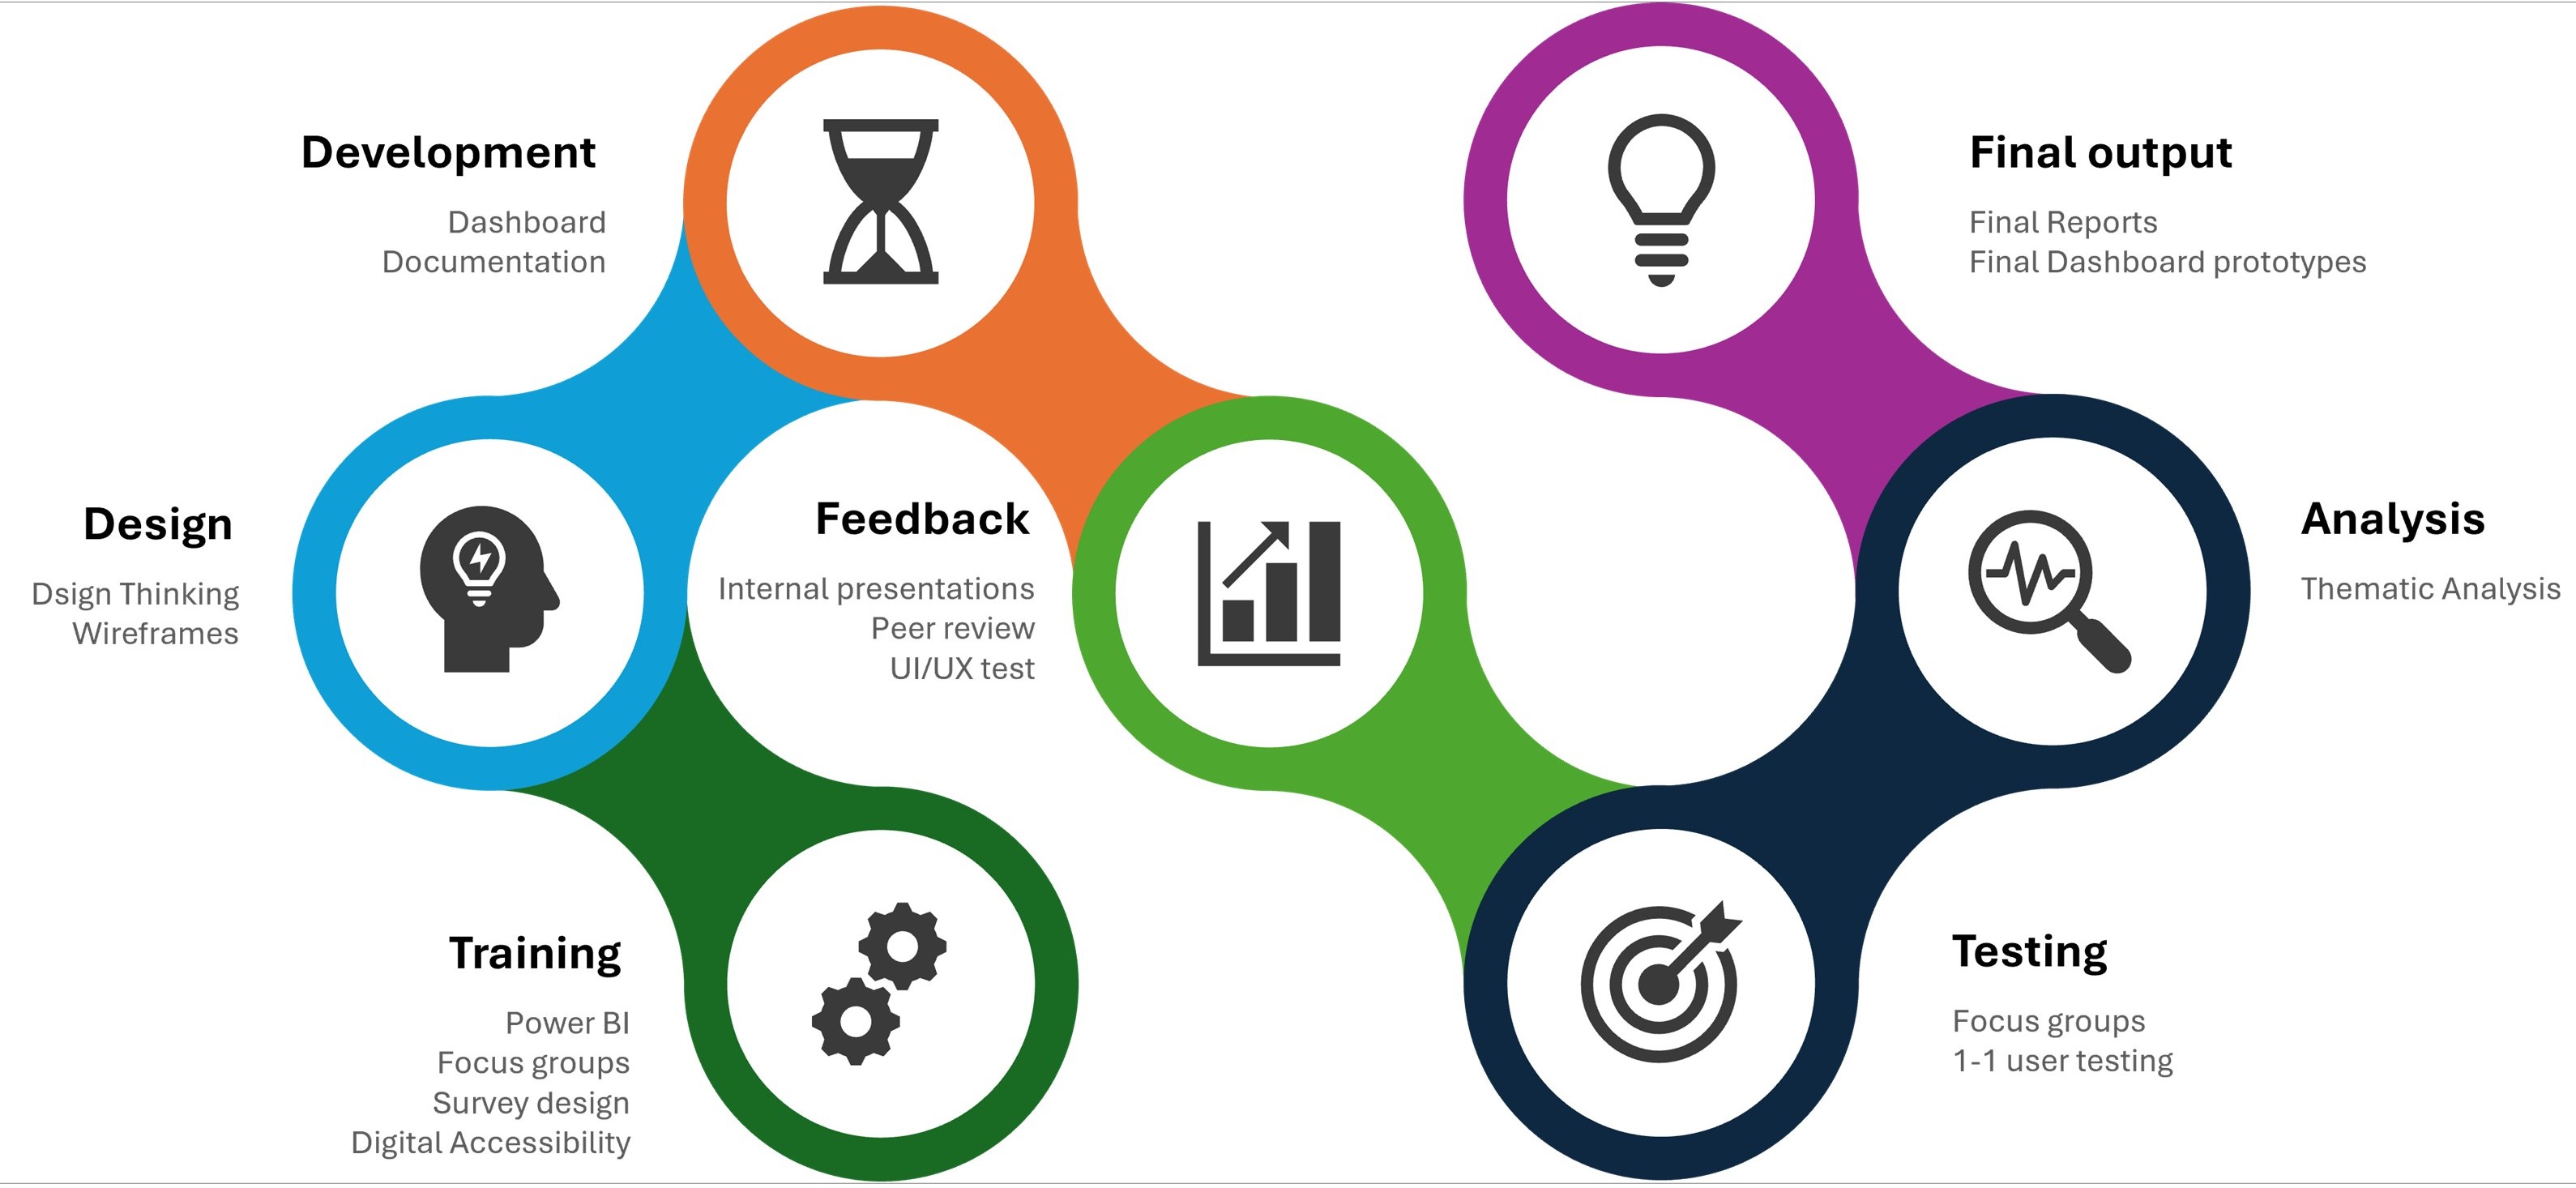
The Student Shapers upskilled themselves, with support from the project team, on handling anonymised, aggregated assessment data, ingesting it into the PowerBI environment and creating visualisations in the environment. Using these new skills, they developed the student-facing prototypes and then tested the prototypes they had developed. They documented the key findings from the testing phase into a final report, outlining lessons learned and recommendations for future iterations of the prototypes.
The following section provides more insight what each of the abovementioned phases entailed.
Phases of Student Shaper Training and Work
During the first two weeks of their partnership, the Student Shapers attended a Design Thinking Workshop with the Project Team, in which they created user personas and conducted user mapping activities, to understand how to design a prototype for a potential end-user. They also attended a training workshop on Inclusive and Accessible Design, conducted by Nina Williams, Learning Technologist - FETL.
The Student Shapers also attended several sessions on Power BI with the Project Team in the first two weeks. After familiarising themselves with the environment, they started working with sample, anonymised datasets to upskill themselves in data handling, cleansing, and analysis. They prepared prototypes, and reviewed each other's work (peer review). They presented their work in different forums (to the project team and to the FETL team more broadly) and received feedback on their design and development approaches.
During the Design Phase, the Student Shapers reviewed existing wireframes and prototypes that the Project Team had already developed. They provided a critical student perspective, as they shared how useful/effective the staff-facing prototypes in supporting students during their academic journeys. Following this, they developed wireframes for the student-facing versions of these prototypes. They shared the wireframes created with us, received feedback, and iterated. Once the wireframes were approved by the Project Team, the Student Shapers started work on converting this wireframe into an interactive dashboard. Development began in Power BI and each week, both Student Shapers presented a version of the dashboard, received feedback, and actioned it.
Once the version of the dashboard for each prototype was approved by the Project Team, the Student Shapers upskilled themselves in how to conduct user testing and run focus groups, by reviewing a number of text and video resources that were shared by the Project Team, and prepared their testing plans. Following this, they recruited students—leveraging office mailing lists and their own networks—to test the prototypes they had developed and began the testing phase. The prototyped tools were evaluated through ten 1-1 user interviews and one focus group session with eleven participants. The student testers received a demo of the prototype, were asked to interact with it, and requested to answer questions on usability, usefulness etc.
The feedback collection was done through user interviews and a focus group session with eleven participants. The feedback received was collated, analysed, and documented in a final report which is integrated with the ADA project. User data was processed by transcribing recordings, anonymising transcripts to maintain participant confidentiality, and coding and categorisation. Potential themes and sub-themes were then identified. For quantitative data, visualisations were created to indicate general sentiment displayed by participants as they interacted with the tool. The overall feedback validated the design decisions made and provided insights into what could be addressed in future prototypes. The student testers appreciated viewing module information, expected workloads, and other assessment data in these interactive tools.
Tools Prototyped
Life sciences dashboard prototypes, as developed in collaboration with the student shaper, will be added here in due course.
Mathematics dashboard prototypes, as developed in collaboration with the student shaper, will be added here in due course.
Contact us
Get in touch with the EdTech Lab and AV Support Team: