The map with the potential to transform the transport system
Words: Peter Taylor Whiffen
Dr Ke Han, Senior Lecturer at Imperial Centre for Transport Studies.
Context:
Since their launch nearly ten years ago, ‘Boris Bikes’ – bicycles available as part of London’s cycle hire scheme – have made 70 million journeys and undoubtedly helped many users to be fitter and healthier. But who actually uses them, where do they go – and why? Understanding this, says associate professor Dr Ke Han, is the key to building a truly joined-up transport system for the city.
Background:
“Initially, some critics felt the bikes would mainly be used by tourists or for non-commuting purposes,” says Han, Senior Lecturer at the Centre for Transport Studies. “But they are very popular with London-based commuters, particularly to get to and from public transport hubs such as tube stations.
Mining deep into the data tells us many things about where people live, how they get to work and where congestion hotspots are. That might help to plan transport infrastructure such as road usage or placement of bus stops. In a wider context, it also reveals different behaviours dependent on different social economic status.”
Methodology:
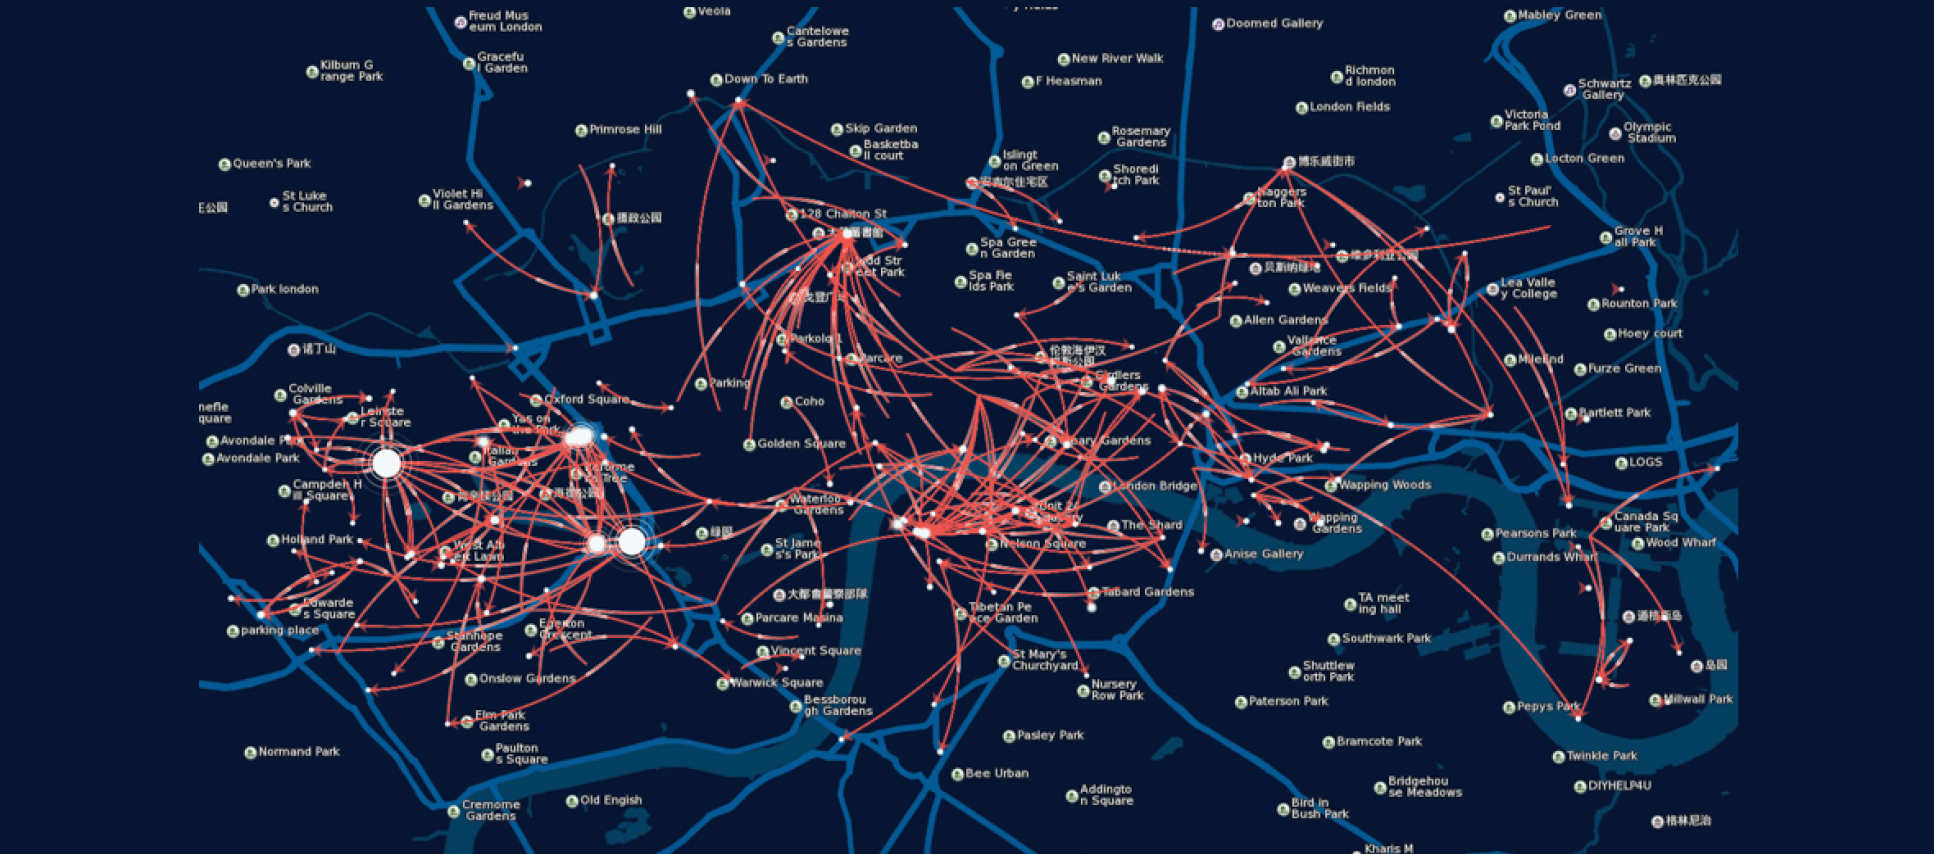
Han and his team analysed existing data from London Data Store and, using a ‘time series clustering’ technique, produced a series of maps and graphs to pinpoint where Santander Cycles (the bike-sharing scheme’s official title) are picked up and dropped off, the spatial and temporal patterns of their usage, the duration of the journeys, and daily and hourly peaks and troughs.
Findings:
“We found the highest concentration around particular stations – for example, King’s Cross and Waterloo,” says Han. “This suggests they are used for last-mile commuting.” The shapes of the hourly pick-up and return curves of the stations are indicative of the surrounding land use, such as residential areas, transport hubs or business districts.
“We also defined particular ‘communities’ of London and found that the vast majority of bikes are picked up and returned in that same community. In other significant usage areas such as Hyde Park, even though the bikes are again picked up and returned a short distance from each other, the hire pattern is more even through the day and the journeys are longer, suggesting these are leisure users.”
Outcomes:
Han’s work has valuable insights for the cycle scheme itself, but the patterns he reveals could also influence London’s transport policy. “As well as enabling the scheme to distribute bikes more efficiently,” he says, “we can delve deeper and ask, for example, why people are choosing to cycle rather than walk in certain areas, or if this movement of people can be managed with financial incentives, to encourage them to cycle to a certain tube stop rather than the congested one, or even to entice them into areas where commercial operators want them – such as Oxford Street.
The bikes should not operate in isolation but in an integrated, properly joined-up policy with buses, tubes and road systems. This data offers so much potential to explore the movement of people around the capital, and to plan infrastructure accordingly. Next steps include exploring similar types of mobility data, such as the stationless, floating bike sharing scheme (Mobike) that has been in operation in London and Beijing, to gain deeper insights into urban mobility patterns and inform policymaking.”